 |
 |
 |
 |
 |
 |
 |
 |
 |
 |
 |
 |
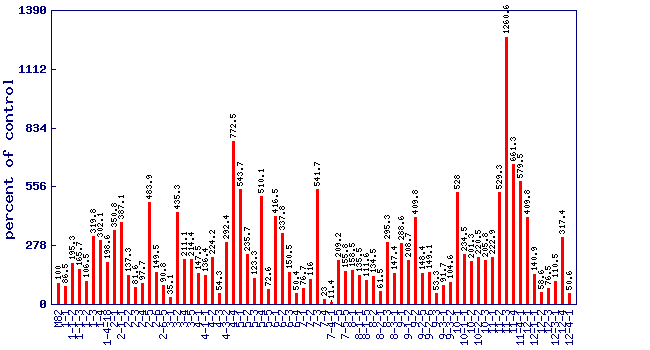
| Relative trans-2-hexenal level (percent of control)* Experiment: flavor related metabolite profiling in S. pennellii IL lines (FL, Spring 2003, Field) |
 |
| line | relative level (percent of control) |
|---|---|
| M82 | 100 |
| 1-1 | 86.5 |
| 1-1-2 | 195.3 |
| 1-1-3 | 165.7 |
| 1-2 | 106.5 |
| 1-3 | 319.8 |
| 1-4 | 302.1 |
| 1-4-18 | 198.6 |
| 2-1 | 350.8 |
| 2-1-1 | 387.1 |
| 2-2 | 137.3 |
| 2-3 | 81.6 |
| 2-4 | 97.7 |
| 2-5 | 483.9 |
| 2-6 | 149.5 |
| 2-6-5 | 90.8 |
| 3-1 | 35.1 |
| 3-2 | 435.3 |
| 3-4 | 211.1 |
| 3-5 | 214.4 |
| 4-1 | 147.5 |
| 4-1-1 | 136.4 |
| 4-2 | 224.2 |
| 4-3 | 54.3 |
| 4-3-2 | 292.4 |
| 4-4 | 772.5 |
| 5-1 | 543.7 |
| 5-2 | 235.7 |
| 5-3 | 123.3 |
| 5-4 | 510.1 |
| 5-5 | 72.6 |
| 6-1 | 416.5 |
| 6-2 | 337.8 |
| 6-3 | 150.5 |
| 6-4 | 50.4 |
| 7-1 | 76.7 |
| 7-2 | 116 |
| 7-3 | 541.7 |
| 7-4 | 23 |
| 7-4-1 | 11.4 |
| 7-5 | 209.2 |
| 7-5-5 | 155.8 |
| 8-1 | 158.5 |
| 8-1-1 | 135.5 |
| 8-1-5 | 111.6 |
| 8-2 | 134.5 |
| 8-2-1 | 61.5 |
| 8-3 | 295.3 |
| 8-3-1 | 147.4 |
| 9-1 | 288.6 |
| 9-1-2 | 208.7 |
| 9-2 | 409.8 |
| 9-2-5 | 148.4 |
| 9-2-6 | 149.1 |
| 9-3 | 53.3 |
| 9-3-1 | 91.7 |
| 9-3-2 | 104.6 |
| 10-1 | 528 |
| 10-1-1 | 234.5 |
| 10-2 | 201.3 |
| 10-2-2 | 220.5 |
| 10-3 | 205.8 |
| 11-1 | 222.9 |
| 11-2 | 529.3 |
| 11-3 | 1260.6 |
| 11-4 | 661.3 |
| 11-4-1 | 579.5 |
| 12-1 | 409.8 |
| 12-1-1 | 140.9 |
| 12-2 | 58.6 |
| 12-3 | 76.5 |
| 12-3-1 | 110.5 |
| 12-4 | 317.4 |
| 12-4-1 | 50.6 |
* Note
|