 |
 |
 |
 |
 |
 |
 |
 |
 |
 |
 |
 |
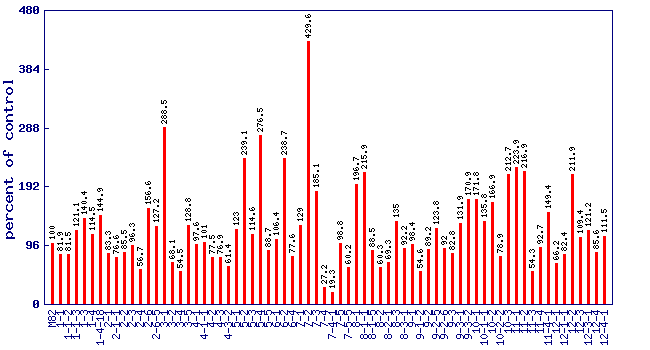
| Relative trans-2-pentenal level (percent of control)* Experiment: flavor related metabolite profiling in S. pennellii IL lines (FL, Fall 2002, Greenhouse) |
 |
| line | relative level (percent of control) |
|---|---|
| M82 | 100 |
| 1-1 | 81.9 |
| 1-1-2 | 81.5 |
| 1-1-3 | 121.1 |
| 1-3 | 140.4 |
| 1-4 | 114.5 |
| 1-4-18 | 144.9 |
| 2-1 | 83.3 |
| 2-1-1 | 76.6 |
| 2-2 | 85.5 |
| 2-3 | 96.3 |
| 2-4 | 56.7 |
| 2-6 | 156.6 |
| 2-6-5 | 127.2 |
| 3-1 | 288.5 |
| 3-2 | 68.1 |
| 3-4 | 54.5 |
| 3-5 | 128.8 |
| 4-1 | 97.6 |
| 4-1-1 | 101 |
| 4-2 | 77.5 |
| 4-3 | 76.9 |
| 4-3-2 | 61.4 |
| 5-1 | 123 |
| 5-2 | 239.1 |
| 5-3 | 114.6 |
| 5-4 | 276.5 |
| 5-5 | 88.7 |
| 6-1 | 106.4 |
| 6-2 | 238.7 |
| 6-4 | 77.6 |
| 7-1 | 129 |
| 7-2 | 429.6 |
| 7-3 | 185.1 |
| 7-4 | 27.2 |
| 7-4-1 | 19.3 |
| 7-5 | 98.8 |
| 7-5-5 | 60.2 |
| 8-1 | 196.7 |
| 8-1-1 | 215.9 |
| 8-1-5 | 88.5 |
| 8-2 | 60.3 |
| 8-2-1 | 69.3 |
| 8-3 | 135 |
| 8-3-1 | 92.2 |
| 9-1 | 98.4 |
| 9-1-2 | 54.6 |
| 9-2 | 89.2 |
| 9-2-5 | 123.8 |
| 9-2-6 | 92 |
| 9-3 | 82.8 |
| 9-3-1 | 131.9 |
| 9-3-2 | 170.9 |
| 10-1 | 171.8 |
| 10-1-1 | 135.8 |
| 10-2 | 166.9 |
| 10-2-2 | 78.9 |
| 10-3 | 212.7 |
| 11-1 | 223.9 |
| 11-2 | 216.9 |
| 11-3 | 54.3 |
| 11-4 | 92.7 |
| 11-4-1 | 149.4 |
| 12-1 | 66.2 |
| 12-1-1 | 82.4 |
| 12-2 | 211.9 |
| 12-3 | 109.4 |
| 12-3-1 | 121.2 |
| 12-4 | 85.6 |
| 12-4-1 | 111.5 |
* Note
|