 |
 |
 |
 |
 |
 |
 |
 |
 |
 |
 |
 |
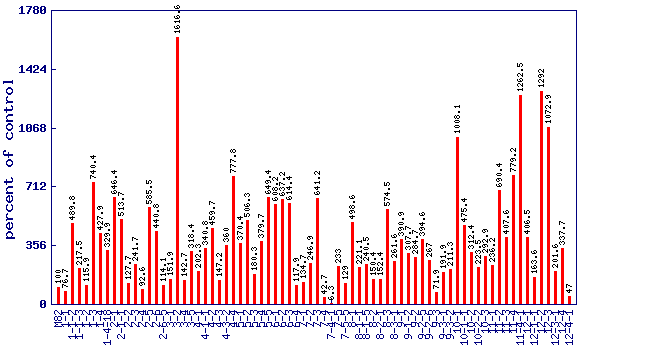
| Relative trans-2-pentenal level (percent of control)* Experiment: flavor related metabolite profiling in S. pennellii IL lines (FL, Spring 2003, Field) |
 |
| line | relative level (percent of control) |
|---|---|
| M82 | 100 |
| 1-1 | 76.7 |
| 1-1-2 | 489.8 |
| 1-1-3 | 217.5 |
| 1-2 | 115.9 |
| 1-3 | 740.4 |
| 1-4 | 427.9 |
| 1-4-18 | 329.9 |
| 2-1 | 646.4 |
| 2-1-1 | 513.7 |
| 2-2 | 127.7 |
| 2-3 | 241.7 |
| 2-4 | 92.6 |
| 2-5 | 585.5 |
| 2-6 | 440.8 |
| 2-6-5 | 114.1 |
| 3-1 | 151.9 |
| 3-2 | 1616.6 |
| 3-4 | 142.7 |
| 3-5 | 318.4 |
| 4-1 | 202.3 |
| 4-1-1 | 340.8 |
| 4-2 | 459.7 |
| 4-3 | 147.2 |
| 4-3-2 | 360 |
| 4-4 | 777.8 |
| 5-1 | 370.4 |
| 5-2 | 506.3 |
| 5-3 | 180.3 |
| 5-4 | 379.7 |
| 5-5 | 649.4 |
| 6-1 | 608.2 |
| 6-2 | 637.2 |
| 6-3 | 614.4 |
| 6-4 | 117.9 |
| 7-1 | 134.7 |
| 7-2 | 246.9 |
| 7-3 | 641.2 |
| 7-4 | 42.7 |
| 7-4-1 | 6.3 |
| 7-5 | 233 |
| 7-5-5 | 129 |
| 8-1 | 498.6 |
| 8-1-1 | 221.1 |
| 8-1-5 | 240.5 |
| 8-2 | 150.4 |
| 8-2-1 | 152.4 |
| 8-3 | 574.5 |
| 8-3-1 | 261.6 |
| 9-1 | 390.9 |
| 9-1-2 | 307.7 |
| 9-2 | 284.7 |
| 9-2-5 | 394.6 |
| 9-2-6 | 267 |
| 9-3 | 71.9 |
| 9-3-1 | 191.9 |
| 9-3-2 | 211.3 |
| 10-1 | 1008.1 |
| 10-1-1 | 475.4 |
| 10-2 | 312.4 |
| 10-2-2 | 223.5 |
| 10-3 | 292.9 |
| 11-1 | 236.2 |
| 11-2 | 690.4 |
| 11-3 | 407.6 |
| 11-4 | 779.2 |
| 11-4-1 | 1262.5 |
| 12-1 | 406.5 |
| 12-1-1 | 163.6 |
| 12-2 | 1292 |
| 12-3 | 1072.9 |
| 12-3-1 | 201.6 |
| 12-4 | 337.7 |
| 12-4-1 | 47 |
* Note
|