 |
 |
 |
 |
 |
 |
 |
 |
 |
 |
 |
 |
| Relative trans-2-pentenal level (percent of control)* Experiment: flavor related metabolite profiling in S. pennellii IL lines (FL, Spring 2004, Field) |
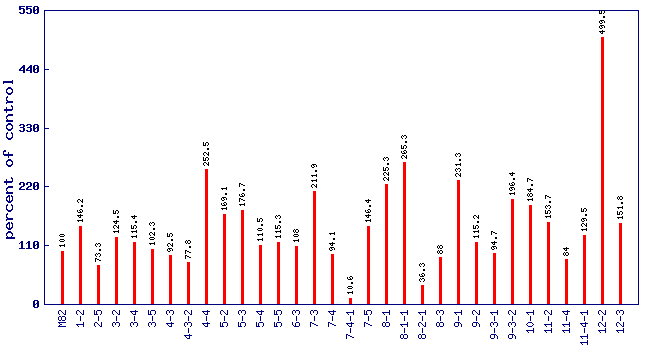 |
| line | relative level (percent of control) |
|---|---|
| M82 | 100 |
| 1-2 | 146.2 |
| 2-5 | 73.3 |
| 3-2 | 124.5 |
| 3-4 | 115.4 |
| 3-5 | 102.3 |
| 4-3 | 92.5 |
| 4-3-2 | 77.8 |
| 4-4 | 252.5 |
| 5-2 | 169.1 |
| 5-3 | 176.7 |
| 5-4 | 110.5 |
| 5-5 | 115.3 |
| 6-3 | 108 |
| 7-3 | 211.9 |
| 7-4 | 94.1 |
| 7-4-1 | 10.6 |
| 7-5 | 146.4 |
| 8-1 | 225.3 |
| 8-1-1 | 265.3 |
| 8-2-1 | 36.3 |
| 8-3 | 88 |
| 9-1 | 231.3 |
| 9-2 | 115.2 |
| 9-3-1 | 94.7 |
| 9-3-2 | 196.4 |
| 10-1 | 184.7 |
| 11-2 | 153.7 |
| 11-4 | 84 |
| 11-4-1 | 129.5 |
| 12-2 | 499.5 |
| 12-3 | 151.8 |
* Note
|