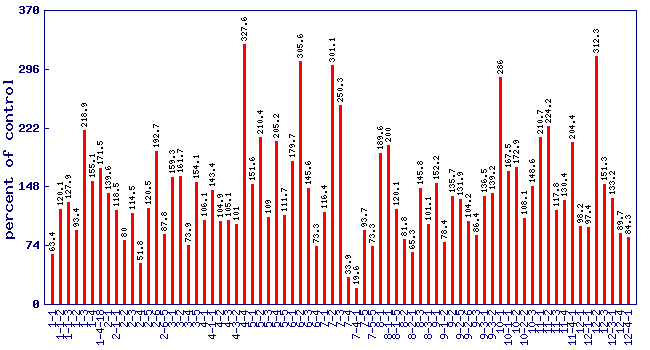
Relative trans-2-pentenal level (percent of control)*
Experiment: flavor related metabolite profiling in S. pennellii IL lines (combined)
|
 |
| line | relative level (percent of control) | p value | FDR |
|---|
| 1-1 | 63.4 | 0.113651 | 0.334151 |
| 1-1-2 | 120.1 | 0.510418 | 0.767978 |
| 1-1-3 | 127.9 | 0.362631 | 0.645924 |
| 1-2 | 93.4 | 0.853248 | 0.938414 |
| 1-3 | 218.9 | 0.00660083 | 0.0465047 |
| 1-4 | 155.1 | 0.159258 | 0.405401 |
| 1-4-18 | 171.5 | 0.0533993 | 0.195218 |
| 2-1 | 139.6 | 0.334496 | 0.620567 |
| 2-1-1 | 118.5 | 0.507867 | 0.766363 |
| 2-2 | 80 | 0.494828 | 0.756193 |
| 2-3 | 114.5 | 0.678166 | 0.867827 |
| 2-4 | 51.8 | 0.0744368 | 0.248615 |
| 2-5 | 120.5 | 0.551378 | 0.797149 |
| 2-6 | 192.7 | 0.0282408 | 0.128804 |
| 2-6-5 | 87.8 | 0.675664 | 0.867401 |
| 3-1 | 159.3 | 0.135191 | 0.367398 |
| 3-2 | 161.7 | 0.0623382 | 0.216711 |
| 3-4 | 73.9 | 0.313342 | 0.599043 |
| 3-5 | 154.1 | 0.0793639 | 0.259302 |
| 4-1 | 106.1 | 0.83142 | 0.933165 |
| 4-1-1 | 143.4 | 0.247364 | 0.526906 |
| 4-2 | 104.9 | 0.862664 | 0.941546 |
| 4-3 | 105.1 | 0.84368 | 0.936608 |
| 4-3-2 | 101 | 0.969372 | 0.983185 |
| 4-4 | 327.6 | 8.6e-05 | 0.00152472 |
| 5-1 | 151.6 | 0.148153 | 0.389459 |
| 5-2 | 210.4 | 0.00384736 | 0.0317205 |
| 5-3 | 109 | 0.744499 | 0.900733 |
| 5-4 | 205.2 | 0.0279628 | 0.128281 |
| 5-5 | 111.7 | 0.682246 | 0.867827 |
| 6-1 | 179.7 | 0.14232 | 0.379198 |
| 6-2 | 305.6 | 0.0666524 | 0.228108 |
| 6-3 | 145.6 | 0.230225 | 0.506408 |
| 6-4 | 73.3 | 0.367657 | 0.649877 |
| 7-1 | 116.4 | 0.598497 | 0.826746 |
| 7-2 | 301.1 | 0.00583505 | 0.0429083 |
| 7-3 | 250.3 | 0.000746847 | 0.00811551 |
| 7-4 | 33.9 | 0.000108957 | 0.00184966 |
| 7-4-1 | 19.6 | 6.02e-11 | 9.46e-09 |
| 7-5 | 93.7 | 0.796984 | 0.915768 |
| 7-5-5 | 73.3 | 0.299196 | 0.584856 |
| 8-1 | 189.6 | 0.0156315 | 0.08724 |
| 8-1-1 | 200 | 0.00487171 | 0.037297 |
| 8-1-5 | 120.1 | 0.448008 | 0.715235 |
| 8-2 | 81.8 | 0.6144 | 0.832139 |
| 8-2-1 | 65.3 | 0.0447138 | 0.174561 |
| 8-3 | 145.8 | 0.163075 | 0.410861 |
| 8-3-1 | 101.1 | 0.967719 | 0.983185 |
| 9-1 | 152.2 | 0.0942632 | 0.291696 |
| 9-1-2 | 78.4 | 0.434767 | 0.706047 |
| 9-2 | 135.7 | 0.159547 | 0.405401 |
| 9-2-5 | 131.9 | 0.258883 | 0.544069 |
| 9-2-6 | 104.2 | 0.889495 | 0.954244 |
| 9-3 | 86.4 | 0.600539 | 0.826843 |
| 9-3-1 | 136.5 | 0.19668 | 0.461004 |
| 9-3-2 | 139.2 | 0.132953 | 0.363694 |
| 10-1 | 286 | 3.04e-05 | 0.000651665 |
| 10-1-1 | 167.5 | 0.057041 | 0.203509 |
| 10-2 | 172.9 | 0.0939588 | 0.291137 |
| 10-2-2 | 108.1 | 0.832365 | 0.933165 |
| 10-3 | 148.6 | 0.203616 | 0.471637 |
| 11-1 | 210.7 | 0.0127049 | 0.0762293 |
| 11-2 | 224.2 | 0.0013223 | 0.0134977 |
| 11-3 | 117.8 | 0.616512 | 0.833564 |
| 11-4 | 130.4 | 0.312631 | 0.599025 |
| 11-4-1 | 204.4 | 0.00450448 | 0.0352651 |
| 12-1 | 98.2 | 0.947767 | 0.978046 |
| 12-1-1 | 97.4 | 0.931759 | 0.970016 |
| 12-2 | 312.3 | 7.91e-07 | 4.14e-05 |
| 12-3 | 151.3 | 0.0751936 | 0.24993 |
| 12-3-1 | 133.2 | 0.276691 | 0.561916 |
| 12-4 | 89.7 | 0.695633 | 0.871111 |
| 12-4-1 | 84.3 | 0.527532 | 0.779398 |
* Note
- A value of zero means the trans-2-pentenal concentration wasbelow the level of dection
- No measure of trans-2-pentenal was performed on lines notshown in the figure and table
|
|


