 |
 |
 |
 |
 |
 |
 |
 |
 |
 |
 |
 |
| Relative pentanal level (percent of control)* Experiment: flavor related metabolite profiling in S. pennellii IL lines (FL, Fall 2002, Greenhouse) |
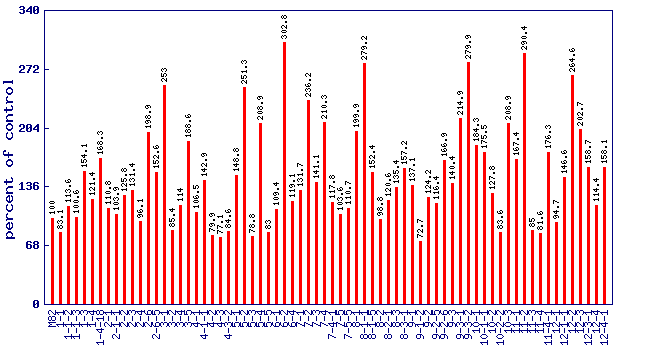 |
| line | relative level (percent of control) |
|---|---|
| M82 | 100 |
| 1-1 | 83.1 |
| 1-1-2 | 113.6 |
| 1-1-3 | 100.6 |
| 1-3 | 154.1 |
| 1-4 | 121.4 |
| 1-4-18 | 168.3 |
| 2-1 | 110.8 |
| 2-1-1 | 103.9 |
| 2-2 | 125.8 |
| 2-3 | 131.4 |
| 2-4 | 96.1 |
| 2-6 | 198.9 |
| 2-6-5 | 152.6 |
| 3-1 | 253 |
| 3-2 | 85.4 |
| 3-4 | 114 |
| 3-5 | 188.6 |
| 4-1 | 106.5 |
| 4-1-1 | 142.9 |
| 4-2 | 79.9 |
| 4-3 | 77.1 |
| 4-3-2 | 84.6 |
| 5-1 | 148.8 |
| 5-2 | 251.3 |
| 5-3 | 78.8 |
| 5-4 | 208.9 |
| 5-5 | 83 |
| 6-1 | 109.4 |
| 6-2 | 302.8 |
| 6-4 | 119.1 |
| 7-1 | 131.7 |
| 7-2 | 236.2 |
| 7-3 | 141.1 |
| 7-4 | 210.3 |
| 7-4-1 | 117.8 |
| 7-5 | 103.6 |
| 7-5-5 | 110.7 |
| 8-1 | 199.9 |
| 8-1-1 | 279.2 |
| 8-1-5 | 152.4 |
| 8-2 | 98.8 |
| 8-2-1 | 120.6 |
| 8-3 | 135.4 |
| 8-3-1 | 157.2 |
| 9-1 | 137.1 |
| 9-1-2 | 72.7 |
| 9-2 | 124.2 |
| 9-2-5 | 116.4 |
| 9-2-6 | 166.9 |
| 9-3 | 140.4 |
| 9-3-1 | 214.9 |
| 9-3-2 | 279.9 |
| 10-1 | 184.3 |
| 10-1-1 | 175.5 |
| 10-2 | 127.8 |
| 10-2-2 | 83.6 |
| 10-3 | 208.9 |
| 11-1 | 167.4 |
| 11-2 | 290.4 |
| 11-3 | 85 |
| 11-4 | 81.6 |
| 11-4-1 | 176.3 |
| 12-1 | 94.7 |
| 12-1-1 | 146.6 |
| 12-2 | 264.6 |
| 12-3 | 202.7 |
| 12-3-1 | 158.7 |
| 12-4 | 114.4 |
| 12-4-1 | 158.1 |
* Note
|