 |
 |
 |
 |
 |
 |
 |
 |
 |
 |
 |
 |
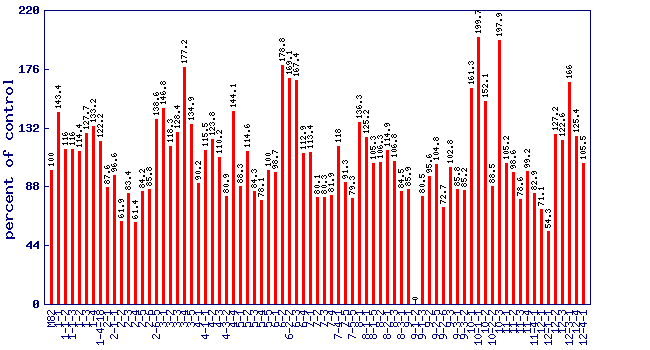
| Relative 280nm phenolics level (percent of control)* Experiment: nutrition related metabolite profiling in S. pennellii IL lines (NY, Summer 2001, Field) |
 |
| line | relative level (percent of control) |
|---|---|
| M82 | 100 |
| 1-1 | 143.4 |
| 1-1-2 | 116 |
| 1-1-3 | 116 |
| 1-2 | 114.4 |
| 1-3 | 127.7 |
| 1-4 | 133.2 |
| 1-4-18 | 122.2 |
| 2-1 | 87.6 |
| 2-1-1 | 96.6 |
| 2-2 | 61.9 |
| 2-3 | 83.4 |
| 2-4 | 61.4 |
| 2-5 | 84.2 |
| 2-6 | 85.8 |
| 2-6-5 | 138.6 |
| 3-1 | 146.8 |
| 3-2 | 118.3 |
| 3-3 | 128.4 |
| 3-4 | 177.2 |
| 3-5 | 134.9 |
| 4-1 | 90.2 |
| 4-1-1 | 115.5 |
| 4-2 | 123.8 |
| 4-3 | 110.2 |
| 4-3-2 | 80.9 |
| 4-4 | 144.1 |
| 5-1 | 88.3 |
| 5-2 | 114.6 |
| 5-3 | 84.3 |
| 5-4 | 78.1 |
| 5-5 | 100 |
| 6-1 | 98.7 |
| 6-2 | 178.8 |
| 6-2-2 | 169.1 |
| 6-3 | 167.4 |
| 6-4 | 112.9 |
| 7-1 | 113.4 |
| 7-2 | 80.1 |
| 7-3 | 80.3 |
| 7-4 | 81.9 |
| 7-4-1 | 118 |
| 7-5 | 91.3 |
| 7-5-5 | 79.3 |
| 8-1 | 136.3 |
| 8-1-1 | 125.2 |
| 8-1-5 | 105.3 |
| 8-2 | 106.3 |
| 8-2-1 | 114.9 |
| 8-3 | 106.8 |
| 8-3-1 | 84.5 |
| 9-1 | 85.9 |
| 9-1-2 | 0 |
| 9-1-3 | 80.5 |
| 9-2 | 95.6 |
| 9-2-5 | 104.8 |
| 9-2-6 | 72.7 |
| 9-3 | 102.8 |
| 9-3-1 | 85.8 |
| 9-3-2 | 85.2 |
| 10-1 | 161.3 |
| 10-1-1 | 199.7 |
| 10-2 | 152.1 |
| 10-2-2 | 88.5 |
| 10-3 | 197.9 |
| 11-1 | 105.2 |
| 11-2 | 98.6 |
| 11-3 | 78.6 |
| 11-4 | 99.2 |
| 11-4-1 | 82.9 |
| 12-1 | 71.1 |
| 12-1-1 | 54.3 |
| 12-2 | 127.2 |
| 12-3 | 122.6 |
| 12-3-1 | 166 |
| 12-4 | 125.4 |
| 12-4-1 | 105.5 |
* Note
|