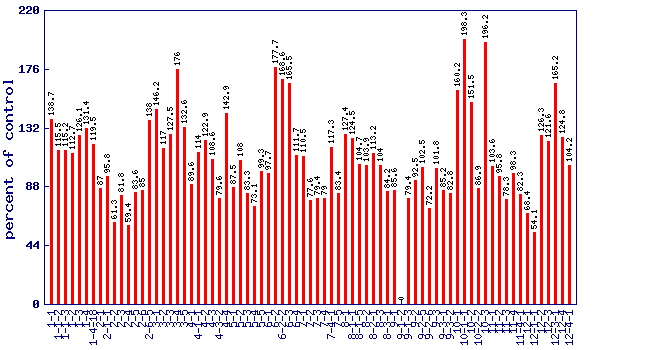
Relative 280nm phenolics level (percent of control)*
Experiment: nutrition related metabolite profiling in S. pennellii IL lines (combined)
|
 |
| line | relative level (percent of control) | p value | FDR |
|---|
| 1-1 | 138.7 | 0.0144183 | 0.0936429 |
| 1-1-2 | 115.5 | 0.277298 | 0.602351 |
| 1-1-3 | 115.2 | 0.28602 | 0.605087 |
| 1-2 | 112.7 | 0.367729 | 0.686748 |
| 1-3 | 126.1 | 0.0815742 | 0.286857 |
| 1-4 | 131.4 | 0.040479 | 0.193256 |
| 1-4-18 | 119.5 | 0.180582 | 0.459698 |
| 2-1 | 87 | 0.29583 | 0.608816 |
| 2-1-1 | 95.8 | 0.743745 | 0.906931 |
| 2-2 | 61.3 | 0.000302081 | 0.00404574 |
| 2-3 | 81.8 | 0.129835 | 0.374475 |
| 2-4 | 59.4 | 0.000124091 | 0.00188715 |
| 2-5 | 83.6 | 0.178197 | 0.456605 |
| 2-6 | 85 | 0.219689 | 0.521943 |
| 2-6-5 | 138 | 0.0159919 | 0.0990819 |
| 3-1 | 146.2 | 0.00461728 | 0.0391799 |
| 3-2 | 117 | 0.237475 | 0.54737 |
| 3-3 | 127.5 | 0.0682798 | 0.260442 |
| 3-4 | 176 | 3.34e-05 | 0.000592356 |
| 3-5 | 132.6 | 0.034264 | 0.172945 |
| 4-1 | 89.6 | 0.405274 | 0.71659 |
| 4-1-1 | 114 | 0.323003 | 0.636339 |
| 4-2 | 122.9 | 0.120521 | 0.358197 |
| 4-3 | 108.6 | 0.533978 | 0.799601 |
| 4-3-2 | 79.6 | 0.087018 | 0.297948 |
| 4-4 | 142.9 | 0.0077045 | 0.0567419 |
| 5-1 | 87.5 | 0.314773 | 0.627339 |
| 5-2 | 108 | 0.560604 | 0.817518 |
| 5-3 | 83.3 | 0.169848 | 0.444974 |
| 5-4 | 73.1 | 0.0191859 | 0.114044 |
| 5-5 | 99.3 | 0.957156 | 0.979643 |
| 6-1 | 97.7 | 0.860528 | 0.943621 |
| 6-2 | 177.7 | 2.48e-05 | 0.000467461 |
| 6-2-2 | 168.6 | 0.0106396 | 0.0746047 |
| 6-3 | 165.5 | 0.00020078 | 0.00279897 |
| 6-4 | 111.7 | 0.404944 | 0.71659 |
| 7-1 | 110.5 | 0.450451 | 0.748196 |
| 7-2 | 77.6 | 0.0564925 | 0.230497 |
| 7-3 | 79.4 | 0.0836267 | 0.290075 |
| 7-4 | 79 | 0.0768293 | 0.277676 |
| 7-4-1 | 117.3 | 0.228529 | 0.534147 |
| 7-5 | 83.4 | 0.0948996 | 0.312156 |
| 8-1 | 127.4 | 0.0689343 | 0.262085 |
| 8-1-1 | 124.5 | 0.0989253 | 0.319123 |
| 8-1-5 | 104.7 | 0.726999 | 0.903521 |
| 8-2 | 103.9 | 0.770972 | 0.913644 |
| 8-2-1 | 113.2 | 0.349896 | 0.666224 |
| 8-3 | 104 | 0.768955 | 0.912306 |
| 8-3-1 | 84.2 | 0.194537 | 0.482986 |
| 9-1 | 85.6 | 0.241913 | 0.552202 |
| 9-1-2 | 0 | 0 | 0 |
| 9-1-3 | 79.4 | 0.0836649 | 0.290075 |
| 9-2 | 92.5 | 0.554839 | 0.812146 |
| 9-2-5 | 102.5 | 0.853214 | 0.941752 |
| 9-2-6 | 72.2 | 0.0147408 | 0.0943247 |
| 9-3 | 101.8 | 0.891879 | 0.95394 |
| 9-3-1 | 85.2 | 0.227944 | 0.533868 |
| 9-3-2 | 82.8 | 0.15638 | 0.42389 |
| 10-1 | 160.2 | 0.000487876 | 0.00626345 |
| 10-1-1 | 198.3 | 6.9e-07 | 2.45e-05 |
| 10-2 | 151.5 | 0.00202292 | 0.0202464 |
| 10-2-2 | 86.9 | 0.289884 | 0.605087 |
| 10-3 | 196.2 | 9.99e-07 | 3.25e-05 |
| 11-1 | 103.6 | 0.787942 | 0.916235 |
| 11-2 | 95.8 | 0.748029 | 0.908874 |
| 11-3 | 78.3 | 0.111965 | 0.345272 |
| 11-4 | 98.3 | 0.898524 | 0.95394 |
| 11-4-1 | 82.3 | 0.143571 | 0.398393 |
| 12-1 | 68.4 | 0.00470536 | 0.0395173 |
| 12-1-1 | 54.1 | 7.1e-06 | 0.000153978 |
| 12-2 | 126.3 | 0.079777 | 0.283088 |
| 12-3 | 121.6 | 0.141399 | 0.397969 |
| 12-3-1 | 165.2 | 0.000209138 | 0.00288118 |
| 12-4 | 124.8 | 0.0963783 | 0.315081 |
| 12-4-1 | 104.2 | 0.756193 | 0.911904 |
* Note
- A value of zero means the 280nm phenolics concentration wasbelow the level of dection
- No measure of 280nm phenolics was performed on lines notshown in the figure and table
|
|


