 |
 |
 |
 |
 |
 |
 |
 |
 |
 |
 |
 |
| Relative 320nm phenolics level (percent of control)* Experiment: nutrition related metabolite profiling in S. pennellii IL lines (NY, Summer 2001, Field) |
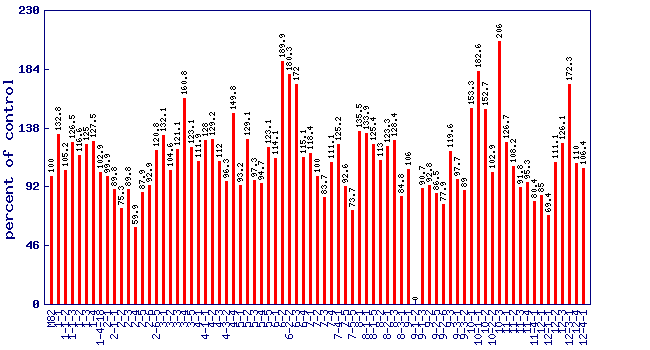 |
| line | relative level (percent of control) |
|---|---|
| M82 | 100 |
| 1-1 | 132.8 |
| 1-1-2 | 105.2 |
| 1-1-3 | 126.5 |
| 1-2 | 116.6 |
| 1-3 | 125 |
| 1-4 | 127.5 |
| 1-4-18 | 102.9 |
| 2-1 | 99.9 |
| 2-1-1 | 89.8 |
| 2-2 | 75.3 |
| 2-3 | 89.8 |
| 2-4 | 59.9 |
| 2-5 | 87.9 |
| 2-6 | 92.9 |
| 2-6-5 | 120.8 |
| 3-1 | 132.1 |
| 3-2 | 104.6 |
| 3-3 | 121.1 |
| 3-4 | 160.8 |
| 3-5 | 123.1 |
| 4-1 | 111.9 |
| 4-1-1 | 128 |
| 4-2 | 129.2 |
| 4-3 | 112 |
| 4-3-2 | 96.3 |
| 4-4 | 149.8 |
| 5-1 | 93.2 |
| 5-2 | 129.1 |
| 5-3 | 97.3 |
| 5-4 | 94.7 |
| 5-5 | 123.1 |
| 6-1 | 114.1 |
| 6-2 | 189.9 |
| 6-2-2 | 180.3 |
| 6-3 | 172 |
| 6-4 | 115.1 |
| 7-1 | 118.4 |
| 7-2 | 100 |
| 7-3 | 83.7 |
| 7-4 | 111.1 |
| 7-4-1 | 125.2 |
| 7-5 | 92.6 |
| 7-5-5 | 73.7 |
| 8-1 | 135.5 |
| 8-1-1 | 133.9 |
| 8-1-5 | 125.4 |
| 8-2 | 113 |
| 8-2-1 | 123.3 |
| 8-3 | 128.4 |
| 8-3-1 | 84.8 |
| 9-1 | 106 |
| 9-1-2 | 0 |
| 9-1-3 | 90.7 |
| 9-2 | 92.8 |
| 9-2-5 | 86.5 |
| 9-2-6 | 77.9 |
| 9-3 | 119.6 |
| 9-3-1 | 97.7 |
| 9-3-2 | 89 |
| 10-1 | 153.3 |
| 10-1-1 | 182.6 |
| 10-2 | 152.7 |
| 10-2-2 | 102.9 |
| 10-3 | 206 |
| 11-1 | 126.7 |
| 11-2 | 108.2 |
| 11-3 | 91.8 |
| 11-4 | 95.3 |
| 11-4-1 | 80.4 |
| 12-1 | 85 |
| 12-1-1 | 69.4 |
| 12-2 | 111.1 |
| 12-3 | 126.1 |
| 12-3-1 | 172.3 |
| 12-4 | 110 |
| 12-4-1 | 106.4 |
* Note
|