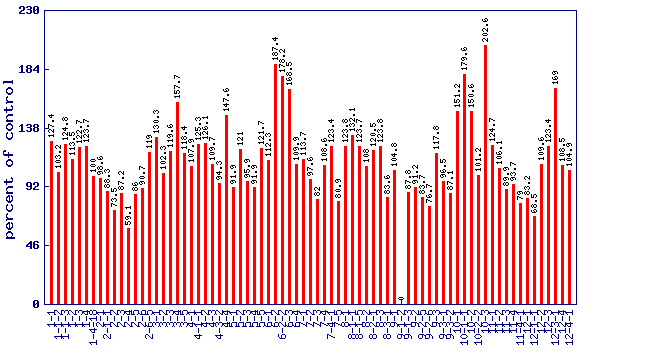
Relative 320nm phenolics level (percent of control)*
Experiment: nutrition related metabolite profiling in S. pennellii IL lines (combined)
|
 |
| line | relative level (percent of control) | p value | FDR |
|---|
| 1-1 | 127.4 | 0.0538523 | 0.223621 |
| 1-1-2 | 103.2 | 0.803094 | 0.921081 |
| 1-1-3 | 124.8 | 0.0782221 | 0.280707 |
| 1-2 | 113.5 | 0.311816 | 0.626308 |
| 1-3 | 122.7 | 0.103722 | 0.327383 |
| 1-4 | 123.7 | 0.0907073 | 0.304433 |
| 1-4-18 | 100 | 0.997874 | 0.997874 |
| 2-1 | 98.6 | 0.910973 | 0.956726 |
| 2-1-1 | 88.3 | 0.318672 | 0.630347 |
| 2-2 | 73.5 | 0.0145542 | 0.0936429 |
| 2-3 | 87.2 | 0.27304 | 0.599908 |
| 2-4 | 59.1 | 4.33e-05 | 0.00073456 |
| 2-5 | 86 | 0.230463 | 0.537594 |
| 2-6 | 90.7 | 0.43392 | 0.738546 |
| 2-6-5 | 119 | 0.165269 | 0.438429 |
| 3-1 | 130.3 | 0.0356511 | 0.176896 |
| 3-2 | 102.3 | 0.857752 | 0.943125 |
| 3-3 | 119.6 | 0.154075 | 0.419859 |
| 3-4 | 157.7 | 0.000358566 | 0.00471776 |
| 3-5 | 118.4 | 0.176907 | 0.455293 |
| 4-1 | 107.9 | 0.542515 | 0.802547 |
| 4-1-1 | 125.3 | 0.0722616 | 0.268227 |
| 4-2 | 126.1 | 0.0651756 | 0.255253 |
| 4-3 | 109.7 | 0.457332 | 0.753043 |
| 4-3-2 | 94.3 | 0.640078 | 0.861569 |
| 4-4 | 147.6 | 0.00217774 | 0.0216113 |
| 5-1 | 91.9 | 0.498631 | 0.777493 |
| 5-2 | 121 | 0.129375 | 0.374068 |
| 5-3 | 95.9 | 0.738565 | 0.904761 |
| 5-4 | 91.9 | 0.499338 | 0.77756 |
| 5-5 | 121.7 | 0.118025 | 0.354988 |
| 6-1 | 112.3 | 0.354591 | 0.672976 |
| 6-2 | 187.4 | 1.32e-06 | 4.07e-05 |
| 6-2-2 | 178.2 | 0.00286182 | 0.0265967 |
| 6-3 | 168.5 | 4.85e-05 | 0.000800446 |
| 6-4 | 109.9 | 0.451199 | 0.748376 |
| 7-1 | 113.7 | 0.306721 | 0.622479 |
| 7-2 | 97.6 | 0.848734 | 0.941752 |
| 7-3 | 82 | 0.11422 | 0.350136 |
| 7-4 | 108.6 | 0.508739 | 0.784893 |
| 7-4-1 | 123.4 | 0.0942727 | 0.311846 |
| 7-5 | 80.9 | 0.0386749 | 0.187142 |
| 8-1 | 123.8 | 0.0897102 | 0.304165 |
| 8-1-1 | 132.1 | 0.0270384 | 0.147953 |
| 8-1-5 | 123.7 | 0.090899 | 0.304433 |
| 8-2 | 108 | 0.535994 | 0.801595 |
| 8-2-1 | 120.5 | 0.136575 | 0.385372 |
| 8-3 | 123.8 | 0.0885756 | 0.301553 |
| 8-3-1 | 83.6 | 0.154175 | 0.419859 |
| 9-1 | 104.8 | 0.708556 | 0.895818 |
| 9-1-2 | 0 | 0 | 0 |
| 9-1-3 | 87.8 | 0.298556 | 0.611204 |
| 9-2 | 91.2 | 0.464137 | 0.75393 |
| 9-2-5 | 83.7 | 0.155135 | 0.421492 |
| 9-2-6 | 76.7 | 0.0351768 | 0.175326 |
| 9-3 | 117.8 | 0.191537 | 0.47823 |
| 9-3-1 | 96.5 | 0.773281 | 0.913736 |
| 9-3-2 | 87.1 | 0.271235 | 0.599276 |
| 10-1 | 151.2 | 0.00115254 | 0.0127323 |
| 10-1-1 | 179.6 | 5.92e-06 | 0.000136019 |
| 10-2 | 150.6 | 0.00128146 | 0.0137669 |
| 10-2-2 | 101.2 | 0.925501 | 0.963344 |
| 10-3 | 202.6 | 7.19e-08 | 3.01e-06 |
| 11-1 | 124.7 | 0.0783871 | 0.280707 |
| 11-2 | 106.1 | 0.638375 | 0.861569 |
| 11-3 | 89.9 | 0.459844 | 0.753115 |
| 11-4 | 93.7 | 0.60244 | 0.84284 |
| 11-4-1 | 79 | 0.0608648 | 0.242424 |
| 12-1 | 83.2 | 0.142618 | 0.398393 |
| 12-1-1 | 68.5 | 0.00289805 | 0.0267214 |
| 12-2 | 109.6 | 0.464204 | 0.75393 |
| 12-3 | 123.4 | 0.0945926 | 0.312022 |
| 12-3-1 | 169 | 4.45e-05 | 0.000744313 |
| 12-4 | 108.5 | 0.513318 | 0.786961 |
| 12-4-1 | 104.9 | 0.700348 | 0.889488 |
* Note
- A value of zero means the 320nm phenolics concentration wasbelow the level of dection
- No measure of 320nm phenolics was performed on lines notshown in the figure and table
|
|


