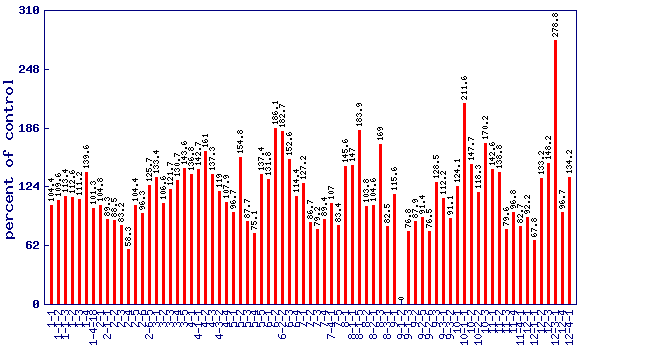
Relative 360nm phenolics level (percent of control)*
Experiment: nutrition related metabolite profiling in S. pennellii IL lines (combined)
|
 |
| line | relative level (percent of control) | p value | FDR |
|---|
| 1-1 | 104.4 | 0.788697 | 0.916235 |
| 1-1-2 | 109.6 | 0.565824 | 0.818 |
| 1-1-3 | 113.4 | 0.428211 | 0.736561 |
| 1-2 | 112.6 | 0.455365 | 0.753043 |
| 1-3 | 111.2 | 0.503508 | 0.779904 |
| 1-4 | 139.6 | 0.0371426 | 0.182485 |
| 1-4-18 | 101.3 | 0.93374 | 0.967114 |
| 2-1 | 104.8 | 0.766694 | 0.912306 |
| 2-1-1 | 89.3 | 0.475764 | 0.762134 |
| 2-2 | 88.5 | 0.442765 | 0.743492 |
| 2-3 | 83.2 | 0.248406 | 0.563728 |
| 2-4 | 58.3 | 0.000852803 | 0.00988745 |
| 2-5 | 104.4 | 0.788468 | 0.916235 |
| 2-6 | 96.3 | 0.814082 | 0.925524 |
| 2-6-5 | 125.7 | 0.151239 | 0.414755 |
| 3-1 | 133.4 | 0.0715296 | 0.268227 |
| 3-2 | 106.6 | 0.68963 | 0.885478 |
| 3-3 | 121.7 | 0.217141 | 0.519154 |
| 3-4 | 130.7 | 0.0936089 | 0.311276 |
| 3-5 | 143.6 | 0.0241328 | 0.135213 |
| 4-1 | 136.8 | 0.0504229 | 0.217879 |
| 4-1-1 | 142.7 | 0.0264094 | 0.145874 |
| 4-2 | 161 | 0.00315451 | 0.0284149 |
| 4-3 | 137.3 | 0.047563 | 0.209957 |
| 4-3-2 | 119 | 0.274562 | 0.600958 |
| 4-4 | 107.9 | 0.632163 | 0.858712 |
| 5-1 | 96.7 | 0.83133 | 0.935767 |
| 5-2 | 154.8 | 0.00665156 | 0.0505778 |
| 5-3 | 87.7 | 0.408237 | 0.719948 |
| 5-4 | 75.1 | 0.0726114 | 0.268227 |
| 5-5 | 137.4 | 0.0473315 | 0.209957 |
| 6-1 | 131.8 | 0.0840072 | 0.290184 |
| 6-2 | 186.1 | 0.00013589 | 0.00204009 |
| 6-2-2 | 182.7 | 0.0140553 | 0.0935159 |
| 6-3 | 152.6 | 0.00862785 | 0.0619829 |
| 6-4 | 114.4 | 0.398577 | 0.709254 |
| 7-1 | 127.2 | 0.132038 | 0.378083 |
| 7-2 | 86.7 | 0.370645 | 0.686748 |
| 7-3 | 79.2 | 0.143286 | 0.398393 |
| 7-4 | 89.4 | 0.48098 | 0.766296 |
| 7-4-1 | 107 | 0.670645 | 0.879619 |
| 7-5 | 83.4 | 0.164012 | 0.438429 |
| 8-1 | 145.6 | 0.0192913 | 0.114091 |
| 8-1-1 | 147 | 0.0164108 | 0.100613 |
| 8-1-5 | 183.9 | 0.000180753 | 0.00264577 |
| 8-2 | 103.8 | 0.816588 | 0.927473 |
| 8-2-1 | 104.6 | 0.777681 | 0.914322 |
| 8-3 | 169 | 0.00117706 | 0.0128816 |
| 8-3-1 | 82.5 | 0.22721 | 0.533868 |
| 9-1 | 115.6 | 0.36332 | 0.682691 |
| 9-1-2 | 0 | 0 | 0 |
| 9-1-3 | 76.8 | 0.0986454 | 0.319099 |
| 9-2 | 87.9 | 0.417402 | 0.729519 |
| 9-2-5 | 91.4 | 0.570867 | 0.821234 |
| 9-2-6 | 76.5 | 0.0938346 | 0.311276 |
| 9-3 | 128.5 | 0.116835 | 0.354441 |
| 9-3-1 | 112.2 | 0.468888 | 0.758382 |
| 9-3-2 | 91.1 | 0.556325 | 0.813304 |
| 10-1 | 124.1 | 0.176418 | 0.455034 |
| 10-1-1 | 211.6 | 5.22e-06 | 0.000122173 |
| 10-2 | 147.7 | 0.0152026 | 0.0963144 |
| 10-2-2 | 118.3 | 0.292309 | 0.60583 |
| 10-3 | 170.2 | 0.00101996 | 0.011375 |
| 11-1 | 142.6 | 0.0267311 | 0.146958 |
| 11-2 | 138.8 | 0.040656 | 0.193256 |
| 11-3 | 79.6 | 0.215835 | 0.519154 |
| 11-4 | 96.8 | 0.8384 | 0.935767 |
| 11-4-1 | 82.7 | 0.23252 | 0.540239 |
| 12-1 | 92.2 | 0.610762 | 0.848401 |
| 12-1-1 | 67.8 | 0.0153596 | 0.0966994 |
| 12-2 | 133.2 | 0.0726095 | 0.268227 |
| 12-3 | 148.2 | 0.0143289 | 0.0936429 |
| 12-3-1 | 278.8 | 1.3e-09 | 8e-08 |
| 12-4 | 96.7 | 0.833227 | 0.935767 |
| 12-4-1 | 134.2 | 0.0659558 | 0.256592 |
* Note
- A value of zero means the 360nm phenolics concentration wasbelow the level of dection
- No measure of 360nm phenolics was performed on lines notshown in the figure and table
|
|


