 |
 |
 |
 |
 |
 |
 |
 |
 |
 |
 |
 |
| Relative cis-lycopene level (percent of control)* Experiment: nutrition related metabolite profiling in S. pennellii IL lines (FL, Spring 2004, Field) |
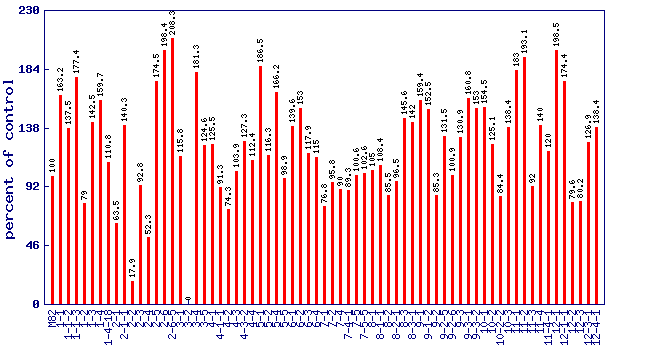 |
| line | relative level (percent of control) |
|---|---|
| M82 | 100 |
| 1-1 | 163.2 |
| 1-1-2 | 137.5 |
| 1-1-3 | 177.4 |
| 1-2 | 79 |
| 1-3 | 142.5 |
| 1-4 | 159.7 |
| 1-4-18 | 110.8 |
| 2-1 | 63.5 |
| 2-1-1 | 140.3 |
| 2-2 | 17.9 |
| 2-3 | 92.8 |
| 2-4 | 52.3 |
| 2-5 | 174.5 |
| 2-6 | 198.4 |
| 2-6-5 | 208.3 |
| 3-1 | 115.8 |
| 3-2 | 0 |
| 3-4 | 181.3 |
| 3-5 | 124.6 |
| 4-1 | 125.5 |
| 4-1-1 | 91.3 |
| 4-2 | 74.3 |
| 4-3 | 103.9 |
| 4-3-2 | 127.3 |
| 4-4 | 112.4 |
| 5-1 | 186.5 |
| 5-2 | 116.3 |
| 5-4 | 166.2 |
| 5-5 | 98.9 |
| 6-1 | 139.6 |
| 6-2 | 153 |
| 6-3 | 117.9 |
| 6-4 | 115 |
| 7-1 | 76.8 |
| 7-2 | 95.8 |
| 7-4 | 90 |
| 7-4-1 | 89.3 |
| 7-5 | 100.6 |
| 7-5-5 | 102.6 |
| 8-1 | 105 |
| 8-1-1 | 108.4 |
| 8-2 | 85.5 |
| 8-2-1 | 96.5 |
| 8-3 | 145.6 |
| 8-3-1 | 142 |
| 9-1 | 159.4 |
| 9-1-2 | 152.5 |
| 9-2 | 85.3 |
| 9-2-5 | 131.5 |
| 9-2-6 | 100.9 |
| 9-3 | 130.9 |
| 9-3-1 | 160.8 |
| 9-3-2 | 153 |
| 10-1 | 154.5 |
| 10-2 | 125.1 |
| 10-2-2 | 84.4 |
| 10-3 | 138.4 |
| 11-1 | 183 |
| 11-2 | 193.1 |
| 11-3 | 92 |
| 11-4 | 140 |
| 11-4-1 | 120 |
| 12-1 | 198.5 |
| 12-1-1 | 174.4 |
| 12-2 | 79.6 |
| 12-3 | 80.2 |
| 12-3-1 | 126.9 |
| 12-4-1 | 138.4 |
* Note
|