 |
 |
 |
 |
 |
 |
 |
 |
 |
 |
 |
 |
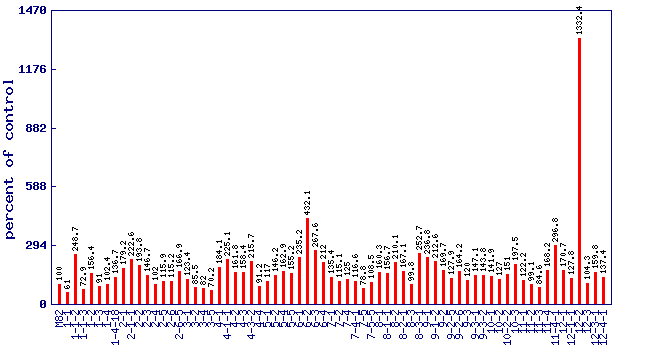
| Relative lutein level (percent of control)* Experiment: nutrition related metabolite profiling in S. pennellii IL lines (FL, Spring 2004, Field) |
 |
| line | relative level (percent of control) |
|---|---|
| M82 | 100 |
| 1-1 | 61 |
| 1-1-2 | 248.7 |
| 1-1-3 | 72.9 |
| 1-2 | 156.4 |
| 1-3 | 91 |
| 1-4 | 102.4 |
| 1-4-18 | 136.7 |
| 2-1 | 179.2 |
| 2-1-1 | 222.6 |
| 2-2 | 193.8 |
| 2-3 | 146.7 |
| 2-4 | 102 |
| 2-5 | 115.9 |
| 2-6 | 115.2 |
| 2-6-5 | 166.9 |
| 3-1 | 123.4 |
| 3-2 | 85.5 |
| 3-4 | 82 |
| 3-5 | 70.2 |
| 4-1 | 184.1 |
| 4-1-1 | 225.1 |
| 4-2 | 161.8 |
| 4-3 | 158.4 |
| 4-3-2 | 215.7 |
| 4-4 | 91.2 |
| 5-1 | 117 |
| 5-2 | 146.2 |
| 5-4 | 162.9 |
| 5-5 | 155.2 |
| 6-1 | 235.2 |
| 6-2 | 432.1 |
| 6-3 | 267.6 |
| 6-4 | 212 |
| 7-1 | 135.4 |
| 7-2 | 115.1 |
| 7-4 | 125 |
| 7-4-1 | 116.6 |
| 7-5 | 78.8 |
| 7-5-5 | 108.5 |
| 8-1 | 160.3 |
| 8-1-1 | 156.7 |
| 8-2 | 210.1 |
| 8-2-1 | 167.1 |
| 8-3 | 99.8 |
| 8-3-1 | 252.7 |
| 9-1 | 236.8 |
| 9-1-2 | 212.6 |
| 9-2 | 169.7 |
| 9-2-5 | 127.9 |
| 9-2-6 | 164.2 |
| 9-3 | 120 |
| 9-3-1 | 147.1 |
| 9-3-2 | 143.8 |
| 10-1 | 141.9 |
| 10-2 | 127 |
| 10-2-2 | 151 |
| 10-3 | 197.5 |
| 11-1 | 122.2 |
| 11-2 | 99.1 |
| 11-3 | 84.6 |
| 11-4 | 168.2 |
| 11-4-1 | 296.8 |
| 12-1 | 170.7 |
| 12-1-1 | 127.8 |
| 12-2 | 1332.4 |
| 12-3 | 104.3 |
| 12-3-1 | 159.8 |
| 12-4-1 | 137.4 |
* Note
|