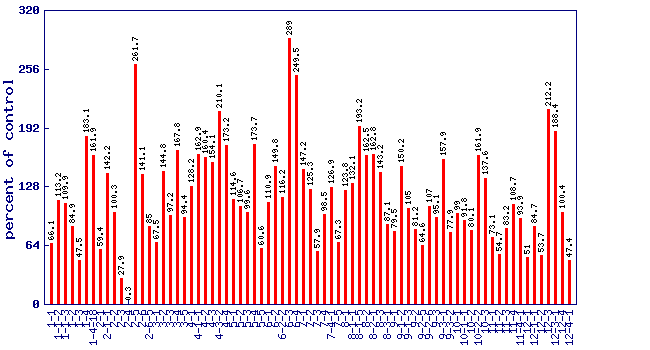
Relative oxygen radical absorbance capacity level (percent of control)*
Experiment: nutrition related metabolite profiling in S. pennellii IL lines (combined)
|
 |
| line | relative level (percent of control) | p value | FDR |
|---|
| 1-1 | 66.1 | 0.389172 | 0.703272 |
| 1-1-2 | 113.2 | 0.795582 | 0.918566 |
| 1-1-3 | 109.9 | 0.843568 | 0.939884 |
| 1-2 | 84.9 | 0.732113 | 0.903521 |
| 1-3 | 47.5 | 0.122721 | 0.362509 |
| 1-4 | 183.1 | 0.208418 | 0.508452 |
| 1-4-18 | 161.9 | 0.315825 | 0.627339 |
| 2-1 | 59.4 | 0.278285 | 0.602351 |
| 2-1-1 | 142.2 | 0.463552 | 0.75393 |
| 2-2 | 100.3 | 0.995439 | 0.997142 |
| 2-3 | 27.9 | 0.00847444 | 0.0612566 |
| 2-4 | 0.3 | 1.77e-24 | 2.59e-22 |
| 2-5 | 261.7 | 0.0463304 | 0.209471 |
| 2-6 | 141.1 | 0.473332 | 0.761362 |
| 2-6-5 | 85 | 0.73422 | 0.903521 |
| 3-1 | 67.5 | 0.412785 | 0.724695 |
| 3-2 | 144.8 | 0.440811 | 0.743492 |
| 3-3 | 97.2 | 0.952831 | 0.977884 |
| 3-4 | 167.8 | 0.281487 | 0.603311 |
| 3-5 | 94.4 | 0.904232 | 0.955646 |
| 4-1 | 128.2 | 0.60487 | 0.844223 |
| 4-1-1 | 162.9 | 0.309968 | 0.626308 |
| 4-2 | 160.4 | 0.325657 | 0.638767 |
| 4-3 | 154.1 | 0.368314 | 0.686748 |
| 4-3-2 | 210.1 | 0.123102 | 0.362509 |
| 4-4 | 173.2 | 0.253076 | 0.567724 |
| 5-1 | 114.6 | 0.776584 | 0.914322 |
| 5-2 | 106.7 | 0.892046 | 0.95394 |
| 5-3 | 99.6 | 0.992946 | 0.996304 |
| 5-4 | 173.7 | 0.250903 | 0.565766 |
| 5-5 | 60.6 | 0.297959 | 0.61105 |
| 6-1 | 110.9 | 0.829267 | 0.935767 |
| 6-2 | 149.8 | 0.465881 | 0.755605 |
| 6-2-2 | 116.2 | 0.837789 | 0.935767 |
| 6-3 | 289 | 0.0281955 | 0.150091 |
| 6-4 | 249.5 | 0.0581944 | 0.234985 |
| 7-1 | 147.2 | 0.420828 | 0.731798 |
| 7-2 | 125.3 | 0.638265 | 0.861569 |
| 7-3 | 57.9 | 0.256446 | 0.572763 |
| 7-4 | 98.5 | 0.974048 | 0.987542 |
| 7-4-1 | 126.9 | 0.619557 | 0.853218 |
| 7-5 | 67.3 | 0.313408 | 0.627339 |
| 8-1 | 123.8 | 0.656234 | 0.873238 |
| 8-1-1 | 132.1 | 0.561787 | 0.817783 |
| 8-1-5 | 193.2 | 0.171145 | 0.447344 |
| 8-2 | 162.5 | 0.312149 | 0.626308 |
| 8-2-1 | 162.8 | 0.310453 | 0.626308 |
| 8-3 | 143.2 | 0.454444 | 0.752693 |
| 8-3-1 | 87.1 | 0.774117 | 0.913801 |
| 9-1 | 79.5 | 0.63299 | 0.858712 |
| 9-1-2 | 150.2 | 0.39726 | 0.708054 |
| 9-1-3 | 105 | 0.918718 | 0.960408 |
| 9-2 | 81.2 | 0.664738 | 0.876834 |
| 9-2-5 | 64.6 | 0.363442 | 0.682691 |
| 9-2-6 | 107 | 0.888531 | 0.95394 |
| 9-3 | 95.1 | 0.917286 | 0.960408 |
| 9-3-1 | 157.9 | 0.341449 | 0.66308 |
| 9-3-2 | 77.9 | 0.601956 | 0.84284 |
| 10-1 | 99 | 0.983119 | 0.991342 |
| 10-1-1 | 91.8 | 0.857594 | 0.943125 |
| 10-2 | 80.1 | 0.643429 | 0.864054 |
| 10-2-2 | 161.9 | 0.31608 | 0.627339 |
| 10-3 | 137.6 | 0.506456 | 0.783435 |
| 11-1 | 73.1 | 0.51344 | 0.786961 |
| 11-2 | 54.7 | 0.210319 | 0.510963 |
| 11-3 | 83.2 | 0.739371 | 0.904761 |
| 11-4 | 108.7 | 0.861688 | 0.943621 |
| 11-4-1 | 93.9 | 0.895873 | 0.95394 |
| 12-1 | 51 | 0.161674 | 0.433226 |
| 12-1-1 | 84.7 | 0.728594 | 0.903521 |
| 12-2 | 53.7 | 0.195708 | 0.483489 |
| 12-3 | 212.2 | 0.118228 | 0.354988 |
| 12-3-1 | 188.4 | 0.188073 | 0.471591 |
| 12-4 | 100.4 | 0.993751 | 0.996304 |
| 12-4-1 | 47.4 | 0.120958 | 0.358588 |
* Note
- A value of zero means the oxygen radical absorbance capacity concentration wasbelow the level of dection
- No measure of oxygen radical absorbance capacity was performed on lines notshown in the figure and table
|
|


