 |
 |
 |
 |
 |
 |
 |
 |
 |
 |
 |
 |
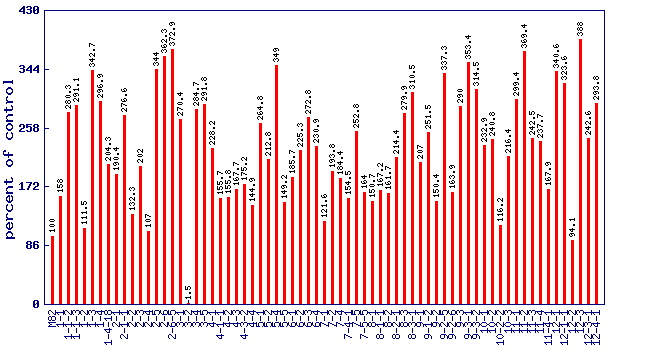
| Relative phytoene level (percent of control)* Experiment: nutrition related metabolite profiling in S. pennellii IL lines (FL, Spring 2004, Field) |
 |
| line | relative level (percent of control) |
|---|---|
| M82 | 100 |
| 1-1 | 158 |
| 1-1-2 | 280.3 |
| 1-1-3 | 291.1 |
| 1-2 | 111.5 |
| 1-3 | 342.7 |
| 1-4 | 296.9 |
| 1-4-18 | 204.3 |
| 2-1 | 190.4 |
| 2-1-1 | 276.6 |
| 2-2 | 132.3 |
| 2-3 | 202 |
| 2-4 | 107 |
| 2-5 | 344 |
| 2-6 | 362.3 |
| 2-6-5 | 372.9 |
| 3-1 | 270.4 |
| 3-2 | 1.5 |
| 3-4 | 284.7 |
| 3-5 | 291.8 |
| 4-1 | 228.2 |
| 4-1-1 | 155.7 |
| 4-2 | 155.8 |
| 4-3 | 167.7 |
| 4-3-2 | 175.2 |
| 4-4 | 144.9 |
| 5-1 | 264.8 |
| 5-2 | 212.8 |
| 5-4 | 349 |
| 5-5 | 149.2 |
| 6-1 | 185.7 |
| 6-2 | 225.3 |
| 6-3 | 272.8 |
| 6-4 | 230.9 |
| 7-1 | 121.6 |
| 7-2 | 193.8 |
| 7-4 | 184.4 |
| 7-4-1 | 154.5 |
| 7-5 | 252.8 |
| 7-5-5 | 164 |
| 8-1 | 150.7 |
| 8-1-1 | 167.2 |
| 8-2 | 161.7 |
| 8-2-1 | 214.4 |
| 8-3 | 279.9 |
| 8-3-1 | 310.5 |
| 9-1 | 207 |
| 9-1-2 | 251.5 |
| 9-2 | 150.4 |
| 9-2-5 | 337.3 |
| 9-2-6 | 163.9 |
| 9-3 | 290 |
| 9-3-1 | 353.4 |
| 9-3-2 | 314.5 |
| 10-1 | 232.9 |
| 10-2 | 240.8 |
| 10-2-2 | 116.2 |
| 10-3 | 216.4 |
| 11-1 | 299.4 |
| 11-2 | 369.4 |
| 11-3 | 242.5 |
| 11-4 | 237.7 |
| 11-4-1 | 167.9 |
| 12-1 | 340.6 |
| 12-1-1 | 323.6 |
| 12-2 | 94.1 |
| 12-3 | 388 |
| 12-3-1 | 242.6 |
| 12-4-1 | 293.8 |
* Note
|