 |
 |
 |
 |
 |
 |
 |
 |
 |
 |
 |
 |
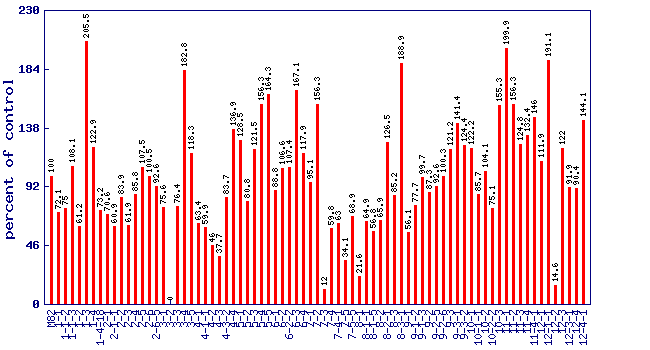
| Relative phytoene level (percent of control)* Experiment: nutrition related metabolite profiling in S. pennellii IL lines (NY, Summer 2001, Field) |
 |
| line | relative level (percent of control) |
|---|---|
| M82 | 100 |
| 1-1 | 72.1 |
| 1-1-2 | 75 |
| 1-1-3 | 108.1 |
| 1-2 | 61.2 |
| 1-3 | 205.5 |
| 1-4 | 122.9 |
| 1-4-18 | 73.2 |
| 2-1 | 70.6 |
| 2-1-1 | 60.9 |
| 2-2 | 83.9 |
| 2-3 | 61.9 |
| 2-4 | 85.8 |
| 2-5 | 107.5 |
| 2-6 | 100.5 |
| 2-6-5 | 92.6 |
| 3-1 | 75.6 |
| 3-2 | 0 |
| 3-3 | 76.4 |
| 3-4 | 182.8 |
| 3-5 | 118.3 |
| 4-1 | 63.4 |
| 4-1-1 | 59.9 |
| 4-2 | 46 |
| 4-3 | 37.7 |
| 4-3-2 | 83.7 |
| 4-4 | 136.9 |
| 5-1 | 128.5 |
| 5-2 | 80.8 |
| 5-3 | 121.5 |
| 5-4 | 156.3 |
| 5-5 | 164.3 |
| 6-1 | 88.8 |
| 6-2 | 106.6 |
| 6-2-2 | 107.4 |
| 6-3 | 167.1 |
| 6-4 | 117.9 |
| 7-1 | 95.1 |
| 7-2 | 156.3 |
| 7-3 | 12 |
| 7-4 | 59.8 |
| 7-4-1 | 63 |
| 7-5 | 34.1 |
| 7-5-5 | 68.9 |
| 8-1 | 21.6 |
| 8-1-1 | 64.9 |
| 8-1-5 | 56.8 |
| 8-2 | 65.9 |
| 8-2-1 | 126.5 |
| 8-3 | 85.2 |
| 8-3-1 | 188.9 |
| 9-1 | 56.1 |
| 9-1-2 | 77.7 |
| 9-1-3 | 99.7 |
| 9-2 | 87.3 |
| 9-2-5 | 92.6 |
| 9-2-6 | 100.3 |
| 9-3 | 121.2 |
| 9-3-1 | 141.4 |
| 9-3-2 | 124.4 |
| 10-1 | 122.2 |
| 10-1-1 | 85.7 |
| 10-2 | 104.1 |
| 10-2-2 | 75.1 |
| 10-3 | 155.3 |
| 11-1 | 199.9 |
| 11-2 | 156.3 |
| 11-3 | 124.8 |
| 11-4 | 132.4 |
| 11-4-1 | 146 |
| 12-1 | 111.9 |
| 12-1-1 | 191.1 |
| 12-2 | 14.6 |
| 12-3 | 122 |
| 12-3-1 | 91.9 |
| 12-4 | 90.4 |
| 12-4-1 | 144.1 |
* Note
|