 |
 |
 |
 |
 |
 |
 |
 |
 |
 |
 |
 |
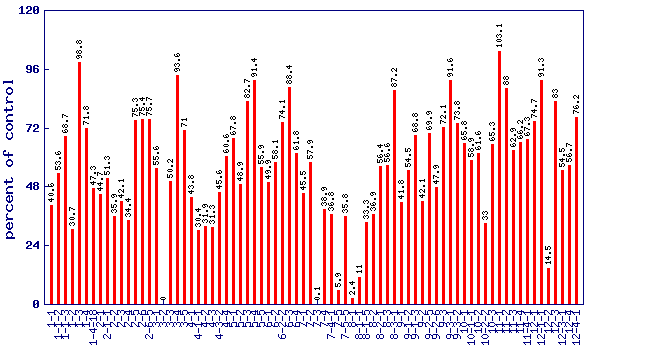
| Relative phytoene level (percent of control)* Experiment: nutrition related metabolite profiling in S. pennellii IL lines (combined) |
 |
| line | relative level (percent of control) | p value | FDR |
|---|---|---|---|
| 1-1 | 40.6 | 0.0958895 | 0.314528 |
| 1-1-2 | 53.6 | 0.340379 | 0.662099 |
| 1-1-3 | 68.7 | 0.487185 | 0.771404 |
| 1-2 | 30.7 | 0.0291891 | 0.151913 |
| 1-3 | 98.8 | 0.981723 | 0.991033 |
| 1-4 | 71.8 | 0.540262 | 0.802547 |
| 1-4-18 | 47.3 | 0.165653 | 0.438429 |
| 2-1 | 44.7 | 0.136242 | 0.385361 |
| 2-1-1 | 51.3 | 0.217238 | 0.519154 |
| 2-2 | 35.9 | 0.0585718 | 0.235696 |
| 2-3 | 42.1 | 0.109801 | 0.341243 |
| 2-4 | 34.4 | 0.0489274 | 0.2122 |
| 2-5 | 75.3 | 0.598594 | 0.841481 |
| 2-6 | 75.4 | 0.601465 | 0.84284 |
| 2-6-5 | 75.7 | 0.622442 | 0.853218 |
| 3-1 | 55.6 | 0.277462 | 0.602351 |
| 3-2 | 0 | 1.37005e-41 | 3.21e-39 |
| 3-3 | 50.2 | 0.345481 | 0.666224 |
| 3-4 | 93.6 | 0.912281 | 0.957241 |
| 3-5 | 71 | 0.525461 | 0.797957 |
| 4-1 | 43.8 | 0.126295 | 0.367889 |
| 4-1-1 | 30.4 | 0.048586 | 0.211503 |
| 4-2 | 31.9 | 0.0346779 | 0.174282 |
| 4-3 | 31.3 | 0.0321124 | 0.164544 |
| 4-3-2 | 45.6 | 0.146352 | 0.405149 |
| 4-4 | 60.6 | 0.405721 | 0.71659 |
| 5-1 | 67.8 | 0.472609 | 0.761244 |
| 5-2 | 48.9 | 0.185314 | 0.468687 |
| 5-3 | 82.7 | 0.795508 | 0.918566 |
| 5-4 | 91.4 | 0.881309 | 0.951164 |
| 5-5 | 55.9 | 0.28182 | 0.603311 |
| 6-1 | 49.9 | 0.221138 | 0.524195 |
| 6-2 | 58.1 | 0.315197 | 0.627339 |
| 6-2-2 | 74.1 | 0.797764 | 0.918566 |
| 6-3 | 88.4 | 0.837636 | 0.935767 |
| 6-4 | 61.8 | 0.372515 | 0.687044 |
| 7-1 | 45.5 | 0.192471 | 0.479539 |
| 7-2 | 57.9 | 0.312161 | 0.626308 |
| 7-3 | 0.1 | 1.16e-21 | 1.36e-19 |
| 7-4 | 38.9 | 0.0806309 | 0.284394 |
| 7-4-1 | 36.8 | 0.064325 | 0.253618 |
| 7-5 | 5.9 | 3.6e-08 | 1.62e-06 |
| 7-5-5 | 35.8 | 0.116198 | 0.353422 |
| 8-1 | 2.4 | 2.02e-11 | 1.58e-09 |
| 8-1-1 | 11 | 5.36e-05 | 0.00085969 |
| 8-1-5 | 33.3 | 0.133249 | 0.380473 |
| 8-2 | 36.9 | 0.0655844 | 0.255998 |
| 8-2-1 | 56.4 | 0.288614 | 0.605087 |
| 8-3 | 56.6 | 0.291564 | 0.605357 |
| 8-3-1 | 87.2 | 0.800073 | 0.918711 |
| 9-1 | 41.8 | 0.106366 | 0.333927 |
| 9-1-2 | 54.5 | 0.314038 | 0.627339 |
| 9-1-3 | 68.8 | 0.609713 | 0.84795 |
| 9-2 | 42.1 | 0.109566 | 0.341243 |
| 9-2-5 | 69.9 | 0.507398 | 0.783856 |
| 9-2-6 | 47.9 | 0.173058 | 0.450336 |
| 9-3 | 72.1 | 0.543938 | 0.802547 |
| 9-3-1 | 91.6 | 0.892829 | 0.95394 |
| 9-3-2 | 73.8 | 0.573886 | 0.82216 |
| 10-1 | 65.8 | 0.461241 | 0.753868 |
| 10-1-1 | 58.9 | 0.469682 | 0.758618 |
| 10-2 | 61.6 | 0.392253 | 0.704589 |
| 10-2-2 | 33 | 0.0407636 | 0.193256 |
| 10-3 | 65.3 | 0.430085 | 0.736561 |
| 11-1 | 103.1 | 0.958998 | 0.979918 |
| 11-2 | 88 | 0.81241 | 0.924521 |
| 11-3 | 62.9 | 0.412662 | 0.724695 |
| 11-4 | 66.2 | 0.44492 | 0.744288 |
| 11-4-1 | 67.3 | 0.511693 | 0.786961 |
| 12-1 | 74.7 | 0.588526 | 0.834339 |
| 12-1-1 | 91.3 | 0.865456 | 0.943621 |
| 12-2 | 14.5 | 0.000379313 | 0.00493528 |
| 12-3 | 83 | 0.729887 | 0.903521 |
| 12-3-1 | 54.5 | 0.260957 | 0.580951 |
| 12-4 | 56.7 | 0.437981 | 0.741151 |
| 12-4-1 | 76.2 | 0.614841 | 0.851039 |
* Note
|