 |
 |
 |
 |
 |
 |
 |
 |
 |
 |
 |
 |
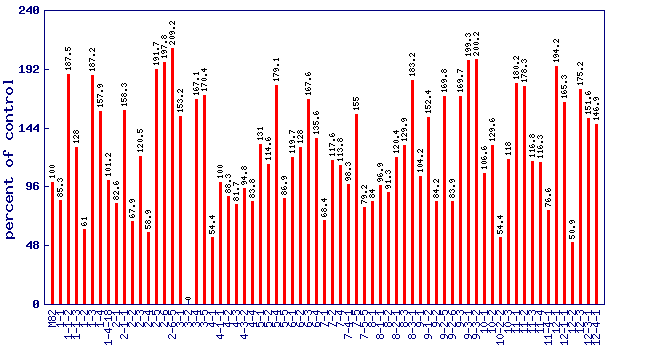
| Relative phytofluene level (percent of control)* Experiment: nutrition related metabolite profiling in S. pennellii IL lines (FL, Spring 2004, Field) |
 |
| line | relative level (percent of control) |
|---|---|
| M82 | 100 |
| 1-1 | 85.3 |
| 1-1-2 | 187.5 |
| 1-1-3 | 128 |
| 1-2 | 61 |
| 1-3 | 187.2 |
| 1-4 | 157.9 |
| 1-4-18 | 101.2 |
| 2-1 | 82.6 |
| 2-1-1 | 158.3 |
| 2-2 | 67.9 |
| 2-3 | 120.5 |
| 2-4 | 58.9 |
| 2-5 | 191.7 |
| 2-6 | 197.8 |
| 2-6-5 | 209.2 |
| 3-1 | 153.2 |
| 3-2 | 0 |
| 3-4 | 167.1 |
| 3-5 | 170.4 |
| 4-1 | 54.4 |
| 4-1-1 | 100 |
| 4-2 | 88.3 |
| 4-3 | 81.7 |
| 4-3-2 | 94.8 |
| 4-4 | 83.8 |
| 5-1 | 131 |
| 5-2 | 114.6 |
| 5-4 | 179.1 |
| 5-5 | 86.9 |
| 6-1 | 119.7 |
| 6-2 | 128 |
| 6-3 | 167.6 |
| 6-4 | 135.6 |
| 7-1 | 68.4 |
| 7-2 | 117.6 |
| 7-4 | 113.8 |
| 7-4-1 | 98.3 |
| 7-5 | 155 |
| 7-5-5 | 79.2 |
| 8-1 | 84 |
| 8-1-1 | 96.9 |
| 8-2 | 91.3 |
| 8-2-1 | 120.4 |
| 8-3 | 129.9 |
| 8-3-1 | 183.2 |
| 9-1 | 104.2 |
| 9-1-2 | 152.4 |
| 9-2 | 84.2 |
| 9-2-5 | 169.8 |
| 9-2-6 | 83.9 |
| 9-3 | 169.7 |
| 9-3-1 | 199.3 |
| 9-3-2 | 200.2 |
| 10-1 | 106.6 |
| 10-2 | 129.6 |
| 10-2-2 | 54.4 |
| 10-3 | 118 |
| 11-1 | 180.2 |
| 11-2 | 178.3 |
| 11-3 | 116.8 |
| 11-4 | 116.3 |
| 11-4-1 | 76.6 |
| 12-1 | 194.2 |
| 12-1-1 | 165.3 |
| 12-2 | 50.9 |
| 12-3 | 175.2 |
| 12-3-1 | 151.6 |
| 12-4-1 | 146.9 |
* Note
|