 |
 |
 |
 |
 |
 |
 |
 |
 |
 |
 |
 |
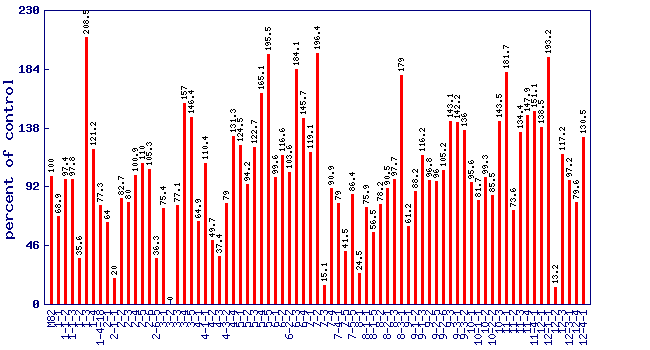
| Relative phytofluene level (percent of control)* Experiment: nutrition related metabolite profiling in S. pennellii IL lines (NY, Summer 2001, Field) |
 |
| line | relative level (percent of control) |
|---|---|
| M82 | 100 |
| 1-1 | 68.9 |
| 1-1-2 | 97.4 |
| 1-1-3 | 97.8 |
| 1-2 | 35.6 |
| 1-3 | 208.5 |
| 1-4 | 121.2 |
| 1-4-18 | 77.3 |
| 2-1 | 64 |
| 2-1-1 | 20 |
| 2-2 | 82.7 |
| 2-3 | 80 |
| 2-4 | 100.9 |
| 2-5 | 110 |
| 2-6 | 105.3 |
| 2-6-5 | 36.3 |
| 3-1 | 75.4 |
| 3-2 | 0 |
| 3-3 | 77.1 |
| 3-4 | 157 |
| 3-5 | 146.4 |
| 4-1 | 64.9 |
| 4-1-1 | 110.4 |
| 4-2 | 49.7 |
| 4-3 | 37.4 |
| 4-3-2 | 79 |
| 4-4 | 131.3 |
| 5-1 | 124.5 |
| 5-2 | 94.2 |
| 5-3 | 122.7 |
| 5-4 | 165.1 |
| 5-5 | 195.5 |
| 6-1 | 99.6 |
| 6-2 | 116.6 |
| 6-2-2 | 103.6 |
| 6-3 | 184.1 |
| 6-4 | 145.7 |
| 7-1 | 119.1 |
| 7-2 | 196.4 |
| 7-3 | 15.1 |
| 7-4 | 90.9 |
| 7-4-1 | 79 |
| 7-5 | 41.5 |
| 7-5-5 | 86.4 |
| 8-1 | 24.5 |
| 8-1-1 | 75.9 |
| 8-1-5 | 56.5 |
| 8-2 | 78.2 |
| 8-2-1 | 90.5 |
| 8-3 | 97.7 |
| 8-3-1 | 179 |
| 9-1 | 61.2 |
| 9-1-2 | 88.2 |
| 9-1-3 | 116.2 |
| 9-2 | 96.8 |
| 9-2-5 | 96 |
| 9-2-6 | 105.2 |
| 9-3 | 143.1 |
| 9-3-1 | 142.2 |
| 9-3-2 | 136 |
| 10-1 | 95.6 |
| 10-1-1 | 81.7 |
| 10-2 | 99.3 |
| 10-2-2 | 85.5 |
| 10-3 | 143.5 |
| 11-1 | 181.7 |
| 11-2 | 73.6 |
| 11-3 | 134.4 |
| 11-4 | 147.9 |
| 11-4-1 | 151.1 |
| 12-1 | 138.5 |
| 12-1-1 | 193.2 |
| 12-2 | 13.2 |
| 12-3 | 117.2 |
| 12-3-1 | 97.2 |
| 12-4 | 79.6 |
| 12-4-1 | 130.5 |
* Note
|