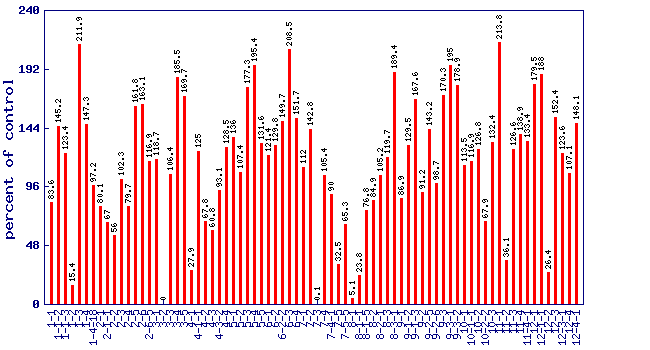
Relative phytofluene level (percent of control)*
Experiment: nutrition related metabolite profiling in S. pennellii IL lines (combined)
|
 |
| line | relative level (percent of control) | p value | FDR |
|---|
| 1-1 | 83.6 | 0.772423 | 0.913644 |
| 1-1-2 | 145.2 | 0.6193 | 0.853218 |
| 1-1-3 | 123.4 | 0.734445 | 0.903521 |
| 1-2 | 15.4 | 0.0027123 | 0.0260336 |
| 1-3 | 211.9 | 0.226366 | 0.53335 |
| 1-4 | 147.3 | 0.53242 | 0.79949 |
| 1-4-18 | 97.2 | 0.96331 | 0.98261 |
| 2-1 | 80.1 | 0.720719 | 0.899746 |
| 2-1-1 | 67 | 0.519268 | 0.792781 |
| 2-2 | 56 | 0.349851 | 0.666224 |
| 2-3 | 102.3 | 0.97093 | 0.98591 |
| 2-4 | 79.7 | 0.71514 | 0.898031 |
| 2-5 | 161.8 | 0.437955 | 0.741151 |
| 2-6 | 163.1 | 0.430227 | 0.736561 |
| 2-6-5 | 116.9 | 0.809985 | 0.924315 |
| 3-1 | 118.7 | 0.782673 | 0.916235 |
| 3-2 | 0 | 1.62e-34 | 3.16e-32 |
| 3-3 | 106.4 | 0.941218 | 0.970217 |
| 3-4 | 185.5 | 0.372451 | 0.687044 |
| 3-5 | 169.7 | 0.393753 | 0.705022 |
| 4-1 | 27.9 | 0.040181 | 0.192836 |
| 4-1-1 | 125 | 0.746954 | 0.908874 |
| 4-2 | 67.8 | 0.531163 | 0.79949 |
| 4-3 | 60.8 | 0.422456 | 0.731798 |
| 4-3-2 | 93.1 | 0.908251 | 0.95567 |
| 4-4 | 128.5 | 0.717474 | 0.898064 |
| 5-1 | 136 | 0.619757 | 0.853218 |
| 5-2 | 107.4 | 0.908567 | 0.95567 |
| 5-3 | 177.3 | 0.495425 | 0.776104 |
| 5-4 | 195.4 | 0.333653 | 0.651904 |
| 5-5 | 131.6 | 0.65753 | 0.87397 |
| 6-1 | 121.4 | 0.766318 | 0.912306 |
| 6-2 | 129.8 | 0.673818 | 0.880626 |
| 6-2-2 | 149.7 | 0.76364 | 0.912306 |
| 6-3 | 208.5 | 0.28917 | 0.605087 |
| 6-4 | 151.7 | 0.501639 | 0.779273 |
| 7-1 | 112 | 0.870342 | 0.948066 |
| 7-2 | 142.8 | 0.565494 | 0.818 |
| 7-3 | 0.1 | 1.44e-14 | 1.4e-12 |
| 7-4 | 105.4 | 0.932791 | 0.967114 |
| 7-4-1 | 90 | 0.86527 | 0.943621 |
| 7-5 | 32.5 | 0.0522006 | 0.220839 |
| 7-5-5 | 65.3 | 0.569997 | 0.820992 |
| 8-1 | 5.1 | 2.1e-06 | 6e-05 |
| 8-1-1 | 23.8 | 0.0210847 | 0.121626 |
| 8-1-5 | 76.8 | 0.753084 | 0.911904 |
| 8-2 | 84.9 | 0.791674 | 0.917872 |
| 8-2-1 | 105.2 | 0.934904 | 0.967114 |
| 8-3 | 119.7 | 0.772005 | 0.913644 |
| 8-3-1 | 189.4 | 0.303433 | 0.619024 |
| 9-1 | 86.9 | 0.821087 | 0.931679 |
| 9-1-2 | 129.5 | 0.709357 | 0.895818 |
| 9-1-3 | 167.6 | 0.538501 | 0.802447 |
| 9-2 | 91.2 | 0.882389 | 0.951452 |
| 9-2-5 | 143.2 | 0.562355 | 0.817783 |
| 9-2-6 | 98.7 | 0.983723 | 0.991342 |
| 9-3 | 170.3 | 0.390921 | 0.704259 |
| 9-3-1 | 195 | 0.374001 | 0.687071 |
| 9-3-2 | 178.9 | 0.348322 | 0.666224 |
| 10-1 | 113.5 | 0.846148 | 0.941156 |
| 10-1-1 | 116.9 | 0.852601 | 0.941752 |
| 10-2 | 126.8 | 0.71551 | 0.898031 |
| 10-2-2 | 67.9 | 0.533221 | 0.79949 |
| 10-3 | 132.4 | 0.650584 | 0.870667 |
| 11-1 | 213.8 | 0.272909 | 0.599908 |
| 11-2 | 36.1 | 0.100592 | 0.320961 |
| 11-3 | 126.6 | 0.716578 | 0.898064 |
| 11-4 | 138.9 | 0.596608 | 0.841481 |
| 11-4-1 | 133.4 | 0.6774 | 0.882354 |
| 12-1 | 179.5 | 0.345841 | 0.666224 |
| 12-1-1 | 188 | 0.308848 | 0.625711 |
| 12-2 | 26.4 | 0.0321775 | 0.164544 |
| 12-3 | 152.4 | 0.497078 | 0.776104 |
| 12-3-1 | 123.6 | 0.732274 | 0.903521 |
| 12-4 | 107.1 | 0.934701 | 0.967114 |
| 12-4-1 | 148.1 | 0.526747 | 0.797957 |
* Note
- A value of zero means the phytofluene concentration wasbelow the level of dection
- No measure of phytofluene was performed on lines notshown in the figure and table
|
|


