 |
 |
 |
 |
 |
 |
 |
 |
 |
 |
 |
 |
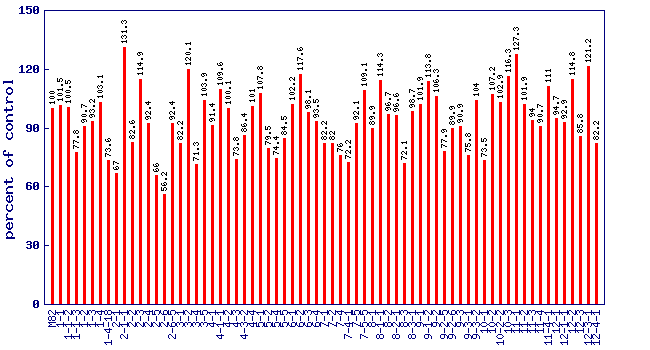
| Relative reduced ascorbate level (percent of control)* Experiment: nutrition related metabolite profiling in S. pennellii IL lines (FL, Spring 2004, Field) |
 |
| line | relative level (percent of control) |
|---|---|
| M82 | 100 |
| 1-1 | 101.5 |
| 1-1-2 | 100.5 |
| 1-1-3 | 77.8 |
| 1-2 | 90.7 |
| 1-3 | 93.2 |
| 1-4 | 103.1 |
| 1-4-18 | 73.6 |
| 2-1 | 67 |
| 2-1-1 | 131.3 |
| 2-2 | 82.6 |
| 2-3 | 114.9 |
| 2-4 | 92.4 |
| 2-5 | 66 |
| 2-6 | 56.2 |
| 2-6-5 | 92.4 |
| 3-1 | 82.2 |
| 3-2 | 120.1 |
| 3-4 | 71.3 |
| 3-5 | 103.9 |
| 4-1 | 91.4 |
| 4-1-1 | 109.6 |
| 4-2 | 100.1 |
| 4-3 | 73.8 |
| 4-3-2 | 86.4 |
| 4-4 | 101 |
| 5-1 | 107.8 |
| 5-2 | 79.5 |
| 5-4 | 74.4 |
| 5-5 | 84.5 |
| 6-1 | 102.2 |
| 6-2 | 117.6 |
| 6-3 | 98.1 |
| 6-4 | 93.5 |
| 7-1 | 82.2 |
| 7-2 | 82 |
| 7-4 | 76 |
| 7-4-1 | 72.2 |
| 7-5 | 92.1 |
| 7-5-5 | 109.1 |
| 8-1 | 89.9 |
| 8-1-1 | 114.3 |
| 8-2 | 96.7 |
| 8-2-1 | 96.6 |
| 8-3 | 72.1 |
| 8-3-1 | 98.7 |
| 9-1 | 101.9 |
| 9-1-2 | 113.8 |
| 9-2 | 106.3 |
| 9-2-5 | 77.9 |
| 9-2-6 | 89.9 |
| 9-3 | 90.9 |
| 9-3-1 | 75.8 |
| 9-3-2 | 104 |
| 10-1 | 73.5 |
| 10-2 | 107.2 |
| 10-2-2 | 102.9 |
| 10-3 | 116.3 |
| 11-1 | 127.3 |
| 11-2 | 101.9 |
| 11-3 | 94 |
| 11-4 | 90.7 |
| 11-4-1 | 111 |
| 12-1 | 94.7 |
| 12-1-1 | 92.9 |
| 12-2 | 114.8 |
| 12-3 | 85.8 |
| 12-3-1 | 121.2 |
| 12-4-1 | 82.2 |
* Note
|