 |
 |
 |
 |
 |
 |
 |
 |
 |
 |
 |
 |
| Relative reduced ascorbate level (percent of control)* Experiment: nutrition related metabolite profiling in S. pennellii IL lines (NY, Summer 2001, Field) |
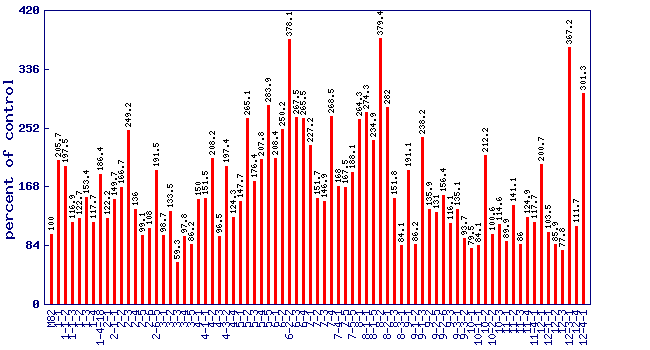 |
| line | relative level (percent of control) |
|---|---|
| M82 | 100 |
| 1-1 | 205.7 |
| 1-1-2 | 197.5 |
| 1-1-3 | 116.9 |
| 1-2 | 122.7 |
| 1-3 | 153.4 |
| 1-4 | 117.7 |
| 1-4-18 | 186.4 |
| 2-1 | 122.2 |
| 2-1-1 | 149.7 |
| 2-2 | 166.7 |
| 2-3 | 249.2 |
| 2-4 | 136 |
| 2-5 | 99.1 |
| 2-6 | 108 |
| 2-6-5 | 191.5 |
| 3-1 | 98.7 |
| 3-2 | 133.5 |
| 3-3 | 59.3 |
| 3-4 | 97.8 |
| 3-5 | 86.2 |
| 4-1 | 150 |
| 4-1-1 | 151.5 |
| 4-2 | 208.2 |
| 4-3 | 96.5 |
| 4-3-2 | 197.4 |
| 4-4 | 124.3 |
| 5-1 | 147.7 |
| 5-2 | 265.1 |
| 5-3 | 176.4 |
| 5-4 | 207.8 |
| 5-5 | 283.9 |
| 6-1 | 208.4 |
| 6-2 | 250.2 |
| 6-2-2 | 378.1 |
| 6-3 | 267.5 |
| 6-4 | 265.5 |
| 7-1 | 227.2 |
| 7-2 | 151.7 |
| 7-3 | 146.9 |
| 7-4 | 268.5 |
| 7-4-1 | 168 |
| 7-5 | 167.5 |
| 7-5-5 | 188.1 |
| 8-1 | 264.3 |
| 8-1-1 | 274.3 |
| 8-1-5 | 234.9 |
| 8-2 | 379.4 |
| 8-2-1 | 282 |
| 8-3 | 151.8 |
| 8-3-1 | 84.1 |
| 9-1 | 191.1 |
| 9-1-2 | 86.2 |
| 9-1-3 | 238.2 |
| 9-2 | 135.9 |
| 9-2-5 | 131 |
| 9-2-6 | 156.4 |
| 9-3 | 116.1 |
| 9-3-1 | 135.1 |
| 9-3-2 | 93.7 |
| 10-1 | 79.5 |
| 10-1-1 | 84.1 |
| 10-2 | 212.2 |
| 10-2-2 | 100.6 |
| 10-3 | 114.6 |
| 11-1 | 89.9 |
| 11-2 | 141.1 |
| 11-3 | 86 |
| 11-4 | 124.9 |
| 11-4-1 | 117.7 |
| 12-1 | 200.7 |
| 12-1-1 | 103.5 |
| 12-2 | 85.9 |
| 12-3 | 77.8 |
| 12-3-1 | 367.2 |
| 12-4 | 111.7 |
| 12-4-1 | 301.3 |
* Note
|