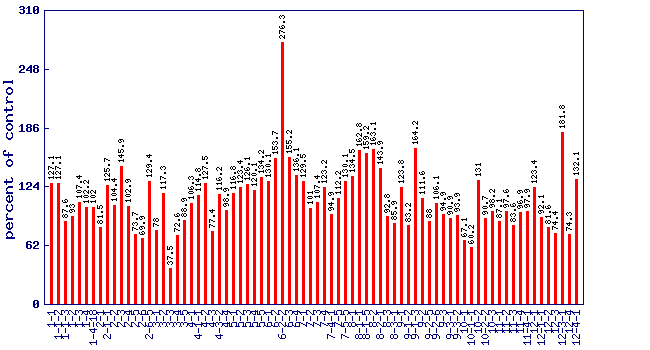
Relative reduced ascorbate level (percent of control)*
Experiment: nutrition related metabolite profiling in S. pennellii IL lines (combined)
|
 |
| line | relative level (percent of control) | p value | FDR |
|---|
| 1-1 | 127.1 | 0.1147 | 0.350687 |
| 1-1-2 | 127.1 | 0.16574 | 0.438429 |
| 1-1-3 | 87.6 | 0.384021 | 0.697192 |
| 1-2 | 93 | 0.630765 | 0.858712 |
| 1-3 | 107.4 | 0.639314 | 0.861569 |
| 1-4 | 102.2 | 0.888084 | 0.95394 |
| 1-4-18 | 102 | 0.897145 | 0.95394 |
| 2-1 | 81.5 | 0.177897 | 0.456605 |
| 2-1-1 | 125.7 | 0.132055 | 0.378083 |
| 2-2 | 104.4 | 0.777277 | 0.914322 |
| 2-3 | 145.9 | 0.0131789 | 0.0892049 |
| 2-4 | 102.9 | 0.851807 | 0.941752 |
| 2-5 | 73.7 | 0.0445212 | 0.202857 |
| 2-6 | 69.9 | 0.0185841 | 0.111553 |
| 2-6-5 | 129.4 | 0.0898727 | 0.304165 |
| 3-1 | 78 | 0.101499 | 0.322102 |
| 3-2 | 117.3 | 0.293551 | 0.606258 |
| 3-3 | 37.5 | 6.56e-06 | 0.000147823 |
| 3-4 | 72.6 | 0.0651503 | 0.255253 |
| 3-5 | 88.9 | 0.437799 | 0.741151 |
| 4-1 | 106.3 | 0.686642 | 0.885478 |
| 4-1-1 | 114.8 | 0.423787 | 0.733021 |
| 4-2 | 127.5 | 0.109862 | 0.341243 |
| 4-3 | 77.4 | 0.0918923 | 0.306569 |
| 4-3-2 | 116.2 | 0.321664 | 0.635192 |
| 4-4 | 98.9 | 0.95049 | 0.976337 |
| 5-1 | 116.8 | 0.305785 | 0.621656 |
| 5-2 | 123.4 | 0.166866 | 0.439142 |
| 5-3 | 126.1 | 0.281033 | 0.603311 |
| 5-4 | 120.1 | 0.289312 | 0.605087 |
| 5-5 | 134.2 | 0.0529496 | 0.223036 |
| 6-1 | 130.1 | 0.0835003 | 0.290075 |
| 6-2 | 153.7 | 0.0048574 | 0.0403405 |
| 6-2-2 | 276.3 | 3.05e-06 | 8.12e-05 |
| 6-3 | 155.2 | 0.0113421 | 0.0777914 |
| 6-4 | 136.1 | 0.0430356 | 0.199594 |
| 7-1 | 129.5 | 0.135056 | 0.38386 |
| 7-2 | 101 | 0.950033 | 0.976337 |
| 7-3 | 107.4 | 0.740961 | 0.904761 |
| 7-4 | 123.2 | 0.169858 | 0.444974 |
| 7-4-1 | 94.9 | 0.73093 | 0.903521 |
| 7-5 | 112.2 | 0.448817 | 0.747603 |
| 7-5-5 | 130.1 | 0.0837278 | 0.290075 |
| 8-1 | 134.5 | 0.0514895 | 0.220206 |
| 8-1-1 | 162.8 | 0.00141822 | 0.014828 |
| 8-1-5 | 159.2 | 0.0310259 | 0.160758 |
| 8-2 | 163.1 | 0.00136337 | 0.0145137 |
| 8-2-1 | 143.9 | 0.0169576 | 0.103424 |
| 8-3 | 92.8 | 0.622616 | 0.853218 |
| 8-3-1 | 85.9 | 0.317927 | 0.629936 |
| 9-1 | 123.8 | 0.16008 | 0.431921 |
| 9-1-2 | 83.2 | 0.286731 | 0.605087 |
| 9-1-3 | 164.2 | 0.0214242 | 0.122979 |
| 9-2 | 111.6 | 0.468624 | 0.758382 |
| 9-2-5 | 88 | 0.401731 | 0.712768 |
| 9-2-6 | 106.1 | 0.698809 | 0.888496 |
| 9-3 | 94.9 | 0.730072 | 0.903521 |
| 9-3-1 | 90.9 | 0.580417 | 0.827855 |
| 9-3-2 | 93.9 | 0.676643 | 0.882349 |
| 10-1 | 67.1 | 0.0216098 | 0.12344 |
| 10-1-1 | 60.2 | 0.0186716 | 0.111553 |
| 10-2 | 131 | 0.0756212 | 0.275008 |
| 10-2-2 | 90.7 | 0.520798 | 0.794082 |
| 10-3 | 98.2 | 0.909152 | 0.95567 |
| 11-1 | 87.1 | 0.424715 | 0.733542 |
| 11-2 | 97.6 | 0.880449 | 0.951112 |
| 11-3 | 83.6 | 0.237818 | 0.54737 |
| 11-4 | 96.9 | 0.837403 | 0.935767 |
| 11-4-1 | 97.9 | 0.901956 | 0.955377 |
| 12-1 | 123.4 | 0.165862 | 0.438429 |
| 12-1-1 | 92.1 | 0.587363 | 0.8337 |
| 12-2 | 81.6 | 0.240082 | 0.550169 |
| 12-3 | 74.4 | 0.0522394 | 0.220839 |
| 12-3-1 | 181.8 | 9.52e-05 | 0.0014869 |
| 12-4 | 74.3 | 0.166882 | 0.439142 |
| 12-4-1 | 132.1 | 0.0672925 | 0.258359 |
* Note
- A value of zero means the reduced ascorbate concentration wasbelow the level of dection
- No measure of reduced ascorbate was performed on lines notshown in the figure and table
|
|


