 |
 |
 |
 |
 |
 |
 |
 |
 |
 |
 |
 |
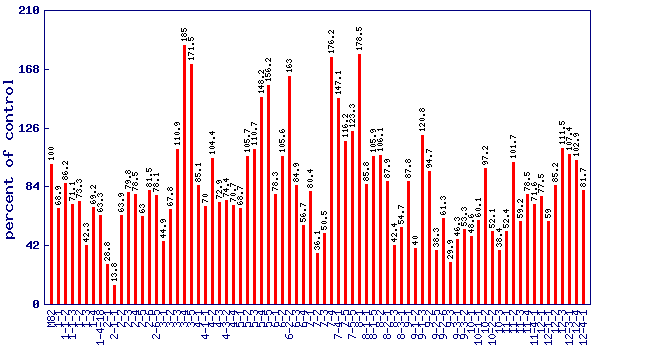
| Relative total ascorbate level (percent of control)* Experiment: nutrition related metabolite profiling in S. pennellii IL lines (NY, Summer 2001, Field) |
 |
| line | relative level (percent of control) |
|---|---|
| M82 | 100 |
| 1-1 | 68.9 |
| 1-1-2 | 86.2 |
| 1-1-3 | 71.1 |
| 1-2 | 73.3 |
| 1-3 | 42.3 |
| 1-4 | 69.2 |
| 1-4-18 | 63.3 |
| 2-1 | 28.8 |
| 2-1-1 | 13.8 |
| 2-2 | 63.9 |
| 2-3 | 79.8 |
| 2-4 | 78.5 |
| 2-5 | 63 |
| 2-6 | 81.5 |
| 2-6-5 | 78.1 |
| 3-1 | 44.9 |
| 3-2 | 67.8 |
| 3-3 | 110.9 |
| 3-4 | 185 |
| 3-5 | 171.5 |
| 4-1 | 85.1 |
| 4-1-1 | 70 |
| 4-2 | 104.4 |
| 4-3 | 72.9 |
| 4-3-2 | 74.4 |
| 4-4 | 70.7 |
| 5-1 | 68.7 |
| 5-2 | 105.7 |
| 5-3 | 110.7 |
| 5-4 | 148.2 |
| 5-5 | 156.2 |
| 6-1 | 78.3 |
| 6-2 | 105.6 |
| 6-2-2 | 163 |
| 6-3 | 84.9 |
| 6-4 | 56.7 |
| 7-1 | 80.4 |
| 7-2 | 36.1 |
| 7-3 | 50.5 |
| 7-4 | 176.2 |
| 7-4-1 | 147.1 |
| 7-5 | 116.2 |
| 7-5-5 | 123.3 |
| 8-1 | 178.5 |
| 8-1-1 | 85.8 |
| 8-1-5 | 105.9 |
| 8-2 | 106.1 |
| 8-2-1 | 87.9 |
| 8-3 | 42.4 |
| 8-3-1 | 54.7 |
| 9-1 | 87.8 |
| 9-1-2 | 40 |
| 9-1-3 | 120.8 |
| 9-2 | 94.7 |
| 9-2-5 | 38.3 |
| 9-2-6 | 61.3 |
| 9-3 | 29.9 |
| 9-3-1 | 46.3 |
| 9-3-2 | 53.3 |
| 10-1 | 48.6 |
| 10-1-1 | 60.1 |
| 10-2 | 97.2 |
| 10-2-2 | 52.1 |
| 10-3 | 38.4 |
| 11-1 | 52.4 |
| 11-2 | 101.7 |
| 11-3 | 59.2 |
| 11-4 | 78.5 |
| 11-4-1 | 71.6 |
| 12-1 | 77.5 |
| 12-1-1 | 59 |
| 12-2 | 85.2 |
| 12-3 | 111.5 |
| 12-3-1 | 107.4 |
| 12-4 | 102.9 |
| 12-4-1 | 81.7 |
* Note
|