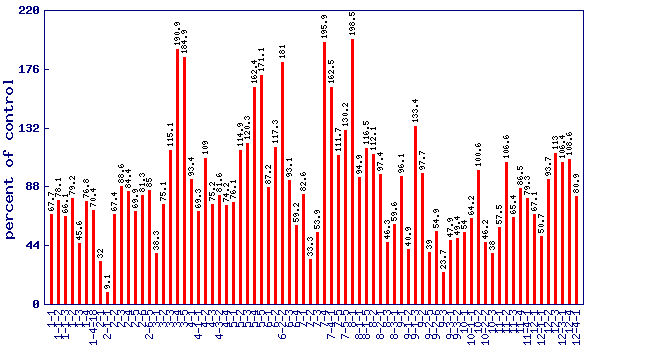
Relative total ascorbate level (percent of control)*
Experiment: nutrition related metabolite profiling in S. pennellii IL lines (combined)
|
 |
| line | relative level (percent of control) | p value | FDR |
|---|
| 1-1 | 67.7 | 0.243898 | 0.554572 |
| 1-1-2 | 78.1 | 0.459827 | 0.753115 |
| 1-1-3 | 66.1 | 0.21682 | 0.519154 |
| 1-2 | 79.2 | 0.486775 | 0.771404 |
| 1-3 | 45.6 | 0.0198766 | 0.115776 |
| 1-4 | 76.8 | 0.43156 | 0.736672 |
| 1-4-18 | 70.4 | 0.295662 | 0.608816 |
| 2-1 | 32 | 0.000829536 | 0.00981199 |
| 2-1-1 | 9.1 | 2.67e-11 | 1.95e-09 |
| 2-2 | 67.4 | 0.239779 | 0.550169 |
| 2-3 | 88.6 | 0.718683 | 0.898162 |
| 2-4 | 84.4 | 0.613176 | 0.849739 |
| 2-5 | 69.9 | 0.285615 | 0.605087 |
| 2-6 | 81.3 | 0.537041 | 0.802137 |
| 2-6-5 | 85 | 0.626453 | 0.855982 |
| 3-1 | 38.3 | 0.00457768 | 0.0391274 |
| 3-2 | 75.1 | 0.392909 | 0.704589 |
| 3-3 | 115.1 | 0.674741 | 0.880849 |
| 3-4 | 190.9 | 0.0547319 | 0.22647 |
| 3-5 | 184.9 | 0.0676804 | 0.258999 |
| 4-1 | 93.4 | 0.839074 | 0.935767 |
| 4-1-1 | 69.3 | 0.273058 | 0.599908 |
| 4-2 | 109 | 0.797286 | 0.918566 |
| 4-3 | 75.2 | 0.394948 | 0.70606 |
| 4-3-2 | 81.6 | 0.54417 | 0.802547 |
| 4-4 | 74.2 | 0.372564 | 0.687044 |
| 5-1 | 76.1 | 0.414757 | 0.727066 |
| 5-2 | 114.9 | 0.678389 | 0.882416 |
| 5-3 | 120.3 | 0.581487 | 0.828371 |
| 5-4 | 162.4 | 0.148716 | 0.408795 |
| 5-5 | 171.1 | 0.109791 | 0.341243 |
| 6-1 | 87.2 | 0.68197 | 0.882416 |
| 6-2 | 117.3 | 0.633731 | 0.858712 |
| 6-2-2 | 181 | 0.077698 | 0.279952 |
| 6-3 | 93.1 | 0.831771 | 0.935767 |
| 6-4 | 59.2 | 0.118883 | 0.35601 |
| 7-1 | 82.6 | 0.567461 | 0.818346 |
| 7-2 | 33.3 | 0.00122248 | 0.0132549 |
| 7-3 | 53.9 | 0.0664881 | 0.257151 |
| 7-4 | 195.9 | 0.0457917 | 0.207838 |
| 7-4-1 | 162.5 | 0.148129 | 0.40839 |
| 7-5 | 111.7 | 0.740944 | 0.904761 |
| 7-5-5 | 130.2 | 0.430598 | 0.736561 |
| 8-1 | 198.5 | 0.0417883 | 0.196523 |
| 8-1-1 | 94.9 | 0.876402 | 0.950841 |
| 8-1-5 | 116.5 | 0.648303 | 0.869602 |
| 8-2 | 112.1 | 0.732677 | 0.903521 |
| 8-2-1 | 97.4 | 0.937365 | 0.968803 |
| 8-3 | 46.3 | 0.0225207 | 0.1274 |
| 8-3-1 | 59.6 | 0.123519 | 0.362509 |
| 9-1 | 96.1 | 0.905253 | 0.95567 |
| 9-1-2 | 40.9 | 0.00825084 | 0.060106 |
| 9-1-3 | 133.4 | 0.389921 | 0.70354 |
| 9-2 | 97.7 | 0.943653 | 0.971871 |
| 9-2-5 | 39 | 0.00545459 | 0.0431576 |
| 9-2-6 | 54.9 | 0.0745753 | 0.272899 |
| 9-3 | 23.7 | 2.81e-05 | 0.000521721 |
| 9-3-1 | 47.9 | 0.0288531 | 0.151511 |
| 9-3-2 | 49.4 | 0.0363485 | 0.179595 |
| 10-1 | 54 | 0.0667583 | 0.257151 |
| 10-1-1 | 64.2 | 0.186712 | 0.471206 |
| 10-2 | 100.6 | 0.985657 | 0.992438 |
| 10-2-2 | 46.2 | 0.0221995 | 0.126192 |
| 10-3 | 38 | 0.00428887 | 0.037202 |
| 11-1 | 57.5 | 0.0997727 | 0.320093 |
| 11-2 | 106.6 | 0.848927 | 0.941752 |
| 11-3 | 65.4 | 0.205507 | 0.502397 |
| 11-4 | 86.5 | 0.664676 | 0.876834 |
| 11-4-1 | 79.3 | 0.488138 | 0.771404 |
| 12-1 | 67.1 | 0.233712 | 0.541934 |
| 12-1-1 | 50.7 | 0.0435594 | 0.200819 |
| 12-2 | 93.7 | 0.846317 | 0.941156 |
| 12-3 | 113 | 0.715311 | 0.898031 |
| 12-3-1 | 106.4 | 0.85293 | 0.941752 |
| 12-4 | 108.6 | 0.804896 | 0.921343 |
| 12-4-1 | 80.9 | 0.526259 | 0.797957 |
* Note
- A value of zero means the total ascorbate concentration wasbelow the level of dection
- No measure of total ascorbate was performed on lines notshown in the figure and table
|
|


