 |
 |
 |
 |
 |
 |
 |
 |
 |
 |
 |
 |
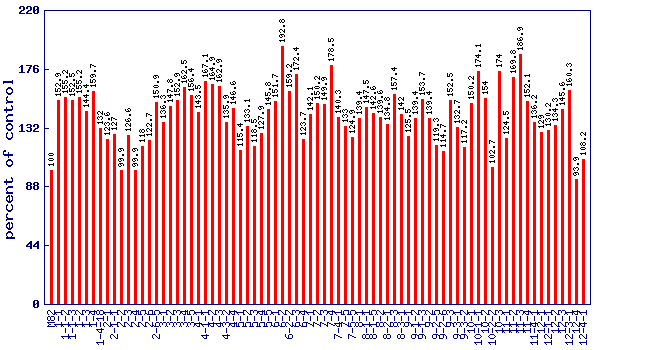
| Relative total phenolics level (percent of control)* Experiment: nutrition related metabolite profiling in S. pennellii IL lines (NY, Summer 2001, Field) |
 |
| line | relative level (percent of control) |
|---|---|
| M82 | 100 |
| 1-1 | 152.9 |
| 1-1-2 | 155.2 |
| 1-1-3 | 152.5 |
| 1-2 | 155.2 |
| 1-3 | 144.4 |
| 1-4 | 159.7 |
| 1-4-18 | 132 |
| 2-1 | 123.6 |
| 2-1-1 | 127 |
| 2-2 | 99.9 |
| 2-3 | 126.6 |
| 2-4 | 99.9 |
| 2-5 | 118 |
| 2-6 | 122.7 |
| 2-6-5 | 150.9 |
| 3-1 | 136.3 |
| 3-2 | 147.8 |
| 3-3 | 152.9 |
| 3-4 | 162.5 |
| 3-5 | 156.4 |
| 4-1 | 143.5 |
| 4-1-1 | 167.1 |
| 4-2 | 164.9 |
| 4-3 | 162.9 |
| 4-3-2 | 135.9 |
| 4-4 | 146.6 |
| 5-1 | 115.4 |
| 5-2 | 133.1 |
| 5-3 | 118.5 |
| 5-4 | 127.9 |
| 5-5 | 145.8 |
| 6-1 | 151.7 |
| 6-2 | 192.8 |
| 6-2-2 | 159.2 |
| 6-3 | 172.4 |
| 6-4 | 123.7 |
| 7-1 | 142.1 |
| 7-2 | 150.2 |
| 7-3 | 149.9 |
| 7-4 | 178.5 |
| 7-4-1 | 140.3 |
| 7-5 | 133 |
| 7-5-5 | 124.9 |
| 8-1 | 139.4 |
| 8-1-1 | 147.5 |
| 8-1-5 | 142.6 |
| 8-2 | 139.6 |
| 8-2-1 | 134.8 |
| 8-3 | 157.4 |
| 8-3-1 | 142 |
| 9-1 | 125.5 |
| 9-1-2 | 139.4 |
| 9-1-3 | 153.7 |
| 9-2 | 139.4 |
| 9-2-5 | 119.3 |
| 9-2-6 | 114.7 |
| 9-3 | 152.5 |
| 9-3-1 | 132.7 |
| 9-3-2 | 117.2 |
| 10-1 | 150.2 |
| 10-1-1 | 174.1 |
| 10-2 | 154 |
| 10-2-2 | 102.7 |
| 10-3 | 174 |
| 11-1 | 124.5 |
| 11-2 | 169.8 |
| 11-3 | 186.9 |
| 11-4 | 152.1 |
| 11-4-1 | 136.2 |
| 12-1 | 129 |
| 12-1-1 | 130.2 |
| 12-2 | 134.3 |
| 12-3 | 145.6 |
| 12-3-1 | 160.3 |
| 12-4 | 93.9 |
| 12-4-1 | 108.2 |
* Note
|