 |
 |
 |
 |
 |
 |
 |
 |
 |
 |
 |
 |
| Relative total tocopherol level (percent of control)* Experiment: nutrition related metabolite profiling in S. pennellii IL lines (NY, Summer 2001, Field) |
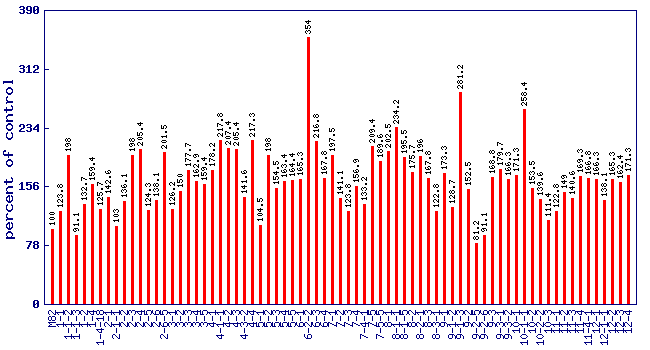 |
| line | relative level (percent of control) |
|---|---|
| M82 | 100 |
| 1-1 | 123.8 |
| 1-1-2 | 198 |
| 1-1-3 | 91.1 |
| 1-2 | 132.7 |
| 1-4 | 159.4 |
| 1-4-18 | 125.7 |
| 2-1 | 142.6 |
| 2-1-1 | 103 |
| 2-2 | 136.1 |
| 2-3 | 198 |
| 2-4 | 205.4 |
| 2-5 | 124.3 |
| 2-6 | 138.1 |
| 2-6-5 | 201.5 |
| 3-1 | 126.2 |
| 3-2 | 150 |
| 3-3 | 177.7 |
| 3-4 | 162.9 |
| 3-5 | 159.4 |
| 4-1 | 178.2 |
| 4-1-1 | 217.8 |
| 4-2 | 207.4 |
| 4-3 | 205.4 |
| 4-3-2 | 141.6 |
| 4-4 | 217.3 |
| 5-1 | 104.5 |
| 5-2 | 198 |
| 5-3 | 154.5 |
| 5-4 | 163.4 |
| 5-5 | 164.4 |
| 6-1 | 165.3 |
| 6-2-2 | 354 |
| 6-3 | 216.8 |
| 6-4 | 167.8 |
| 7-1 | 197.5 |
| 7-2 | 141.1 |
| 7-3 | 123.8 |
| 7-4 | 156.9 |
| 7-4-1 | 133.2 |
| 7-5 | 209.4 |
| 7-5-5 | 189.6 |
| 8-1 | 202.5 |
| 8-1-1 | 234.2 |
| 8-1-5 | 195.5 |
| 8-2 | 175.7 |
| 8-2-1 | 196 |
| 8-3 | 167.8 |
| 8-3-1 | 122.8 |
| 9-1 | 173.3 |
| 9-1-2 | 128.7 |
| 9-1-3 | 281.2 |
| 9-2 | 152.5 |
| 9-2-5 | 81.2 |
| 9-2-6 | 91.1 |
| 9-3 | 168.8 |
| 9-3-1 | 179.7 |
| 9-3-2 | 166.3 |
| 10-1 | 171.3 |
| 10-1-1 | 258.4 |
| 10-2 | 153.5 |
| 10-2-2 | 139.6 |
| 10-3 | 111.4 |
| 11-1 | 122.8 |
| 11-2 | 149 |
| 11-3 | 140.6 |
| 11-4 | 169.3 |
| 11-4-1 | 166.8 |
| 12-1 | 166.3 |
| 12-1-1 | 138.1 |
| 12-2 | 165.3 |
| 12-3 | 162.4 |
| 12-4 | 171.3 |
* Note
|