 |
 |
 |
 |
 |
 |
 |
 |
 |
 |
 |
 |
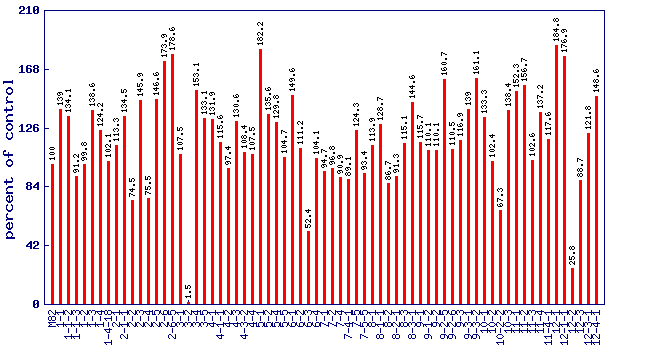
| Relative trans-lycopene level (percent of control)* Experiment: nutrition related metabolite profiling in S. pennellii IL lines (FL, Spring 2004, Field) |
 |
| line | relative level (percent of control) |
|---|---|
| M82 | 100 |
| 1-1 | 139 |
| 1-1-2 | 134.1 |
| 1-1-3 | 91.2 |
| 1-2 | 99.8 |
| 1-3 | 138.6 |
| 1-4 | 124.2 |
| 1-4-18 | 102.1 |
| 2-1 | 113.3 |
| 2-1-1 | 134.5 |
| 2-2 | 74.5 |
| 2-3 | 145.9 |
| 2-4 | 75.5 |
| 2-5 | 146.6 |
| 2-6 | 173.9 |
| 2-6-5 | 178.6 |
| 3-1 | 107.5 |
| 3-2 | 1.5 |
| 3-4 | 153.1 |
| 3-5 | 133.1 |
| 4-1 | 131.9 |
| 4-1-1 | 115.6 |
| 4-2 | 97.4 |
| 4-3 | 130.6 |
| 4-3-2 | 108.4 |
| 4-4 | 107.5 |
| 5-1 | 182.2 |
| 5-2 | 135.6 |
| 5-4 | 129.8 |
| 5-5 | 104.7 |
| 6-1 | 149.6 |
| 6-2 | 111.2 |
| 6-3 | 52.4 |
| 6-4 | 104.1 |
| 7-1 | 94.7 |
| 7-2 | 96.8 |
| 7-4 | 90.9 |
| 7-4-1 | 89.1 |
| 7-5 | 124.3 |
| 7-5-5 | 93.4 |
| 8-1 | 113.9 |
| 8-1-1 | 128.7 |
| 8-2 | 86.7 |
| 8-2-1 | 91.3 |
| 8-3 | 115.1 |
| 8-3-1 | 144.6 |
| 9-1 | 115.7 |
| 9-1-2 | 110.1 |
| 9-2 | 110.1 |
| 9-2-5 | 160.7 |
| 9-2-6 | 110.5 |
| 9-3 | 116.9 |
| 9-3-1 | 139 |
| 9-3-2 | 161.1 |
| 10-1 | 133.3 |
| 10-2 | 102.4 |
| 10-2-2 | 67.3 |
| 10-3 | 138.4 |
| 11-1 | 152.3 |
| 11-2 | 156.7 |
| 11-3 | 102.6 |
| 11-4 | 137.2 |
| 11-4-1 | 117.6 |
| 12-1 | 184.8 |
| 12-1-1 | 176.9 |
| 12-2 | 25.8 |
| 12-3 | 88.7 |
| 12-3-1 | 121.8 |
| 12-4-1 | 148.6 |
* Note
|