 |
 |
 |
 |
 |
 |
 |
 |
 |
 |
 |
 |
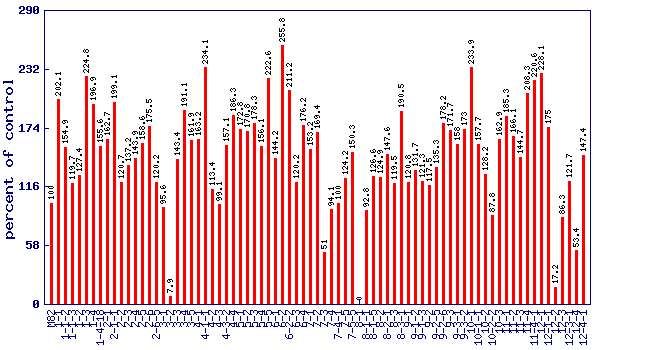
| Relative trans-lycopene level (percent of control)* Experiment: nutrition related metabolite profiling in S. pennellii IL lines (NY, Summer 2001, Field) |
 |
| line | relative level (percent of control) |
|---|---|
| M82 | 100 |
| 1-1 | 202.1 |
| 1-1-2 | 154.9 |
| 1-1-3 | 119.7 |
| 1-2 | 127.4 |
| 1-3 | 224.8 |
| 1-4 | 196.9 |
| 1-4-18 | 155.6 |
| 2-1 | 162.7 |
| 2-1-1 | 199.1 |
| 2-2 | 120.7 |
| 2-3 | 137.2 |
| 2-4 | 143.9 |
| 2-5 | 158.6 |
| 2-6 | 175.5 |
| 2-6-5 | 120.2 |
| 3-1 | 95.6 |
| 3-2 | 7.9 |
| 3-3 | 143.4 |
| 3-4 | 191.1 |
| 3-5 | 161.9 |
| 4-1 | 163.2 |
| 4-1-1 | 234.1 |
| 4-2 | 113.4 |
| 4-3 | 99.1 |
| 4-3-2 | 157.1 |
| 4-4 | 186.3 |
| 5-1 | 172.8 |
| 5-2 | 170.8 |
| 5-3 | 178.3 |
| 5-4 | 156.1 |
| 5-5 | 222.6 |
| 6-1 | 144.2 |
| 6-2 | 255.8 |
| 6-2-2 | 211.2 |
| 6-3 | 120.2 |
| 6-4 | 176.2 |
| 7-1 | 153.2 |
| 7-2 | 169.4 |
| 7-3 | 51 |
| 7-4 | 94.1 |
| 7-4-1 | 100 |
| 7-5 | 124.2 |
| 7-5-5 | 150.3 |
| 8-1 | 0 |
| 8-1-1 | 92.8 |
| 8-1-5 | 126.6 |
| 8-2 | 124.9 |
| 8-2-1 | 147.6 |
| 8-3 | 119.5 |
| 8-3-1 | 190.5 |
| 9-1 | 120.8 |
| 9-1-2 | 131.7 |
| 9-1-3 | 121.3 |
| 9-2 | 117.5 |
| 9-2-5 | 135.3 |
| 9-2-6 | 178.2 |
| 9-3 | 171.7 |
| 9-3-1 | 158 |
| 9-3-2 | 173 |
| 10-1 | 233.9 |
| 10-1-1 | 157.7 |
| 10-2 | 128.2 |
| 10-2-2 | 87.8 |
| 10-3 | 162.9 |
| 11-1 | 185.3 |
| 11-2 | 166.1 |
| 11-3 | 144.7 |
| 11-4 | 208.3 |
| 11-4-1 | 220.6 |
| 12-1 | 228.1 |
| 12-1-1 | 175 |
| 12-2 | 17.2 |
| 12-3 | 86.3 |
| 12-3-1 | 121.7 |
| 12-4 | 53.4 |
| 12-4-1 | 147.4 |
* Note
|