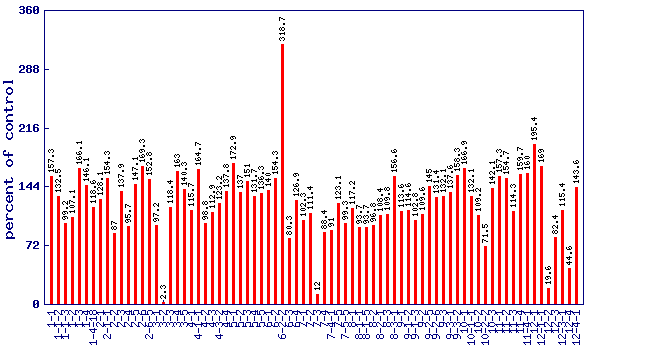
Relative trans-lycopene level (percent of control)*
Experiment: nutrition related metabolite profiling in S. pennellii IL lines (combined)
|
 |
| line | relative level (percent of control) | p value | FDR |
|---|
| 1-1 | 157.3 | 0.00445229 | 0.0383356 |
| 1-1-2 | 132.5 | 0.143056 | 0.398393 |
| 1-1-3 | 99.2 | 0.957891 | 0.979643 |
| 1-2 | 107.1 | 0.663994 | 0.876834 |
| 1-3 | 166.1 | 0.00146223 | 0.0151528 |
| 1-4 | 146.1 | 0.0171489 | 0.104049 |
| 1-4-18 | 118.6 | 0.281336 | 0.603311 |
| 2-1 | 128.1 | 0.119177 | 0.35601 |
| 2-1-1 | 154.3 | 0.0064897 | 0.0496695 |
| 2-2 | 87 | 0.381091 | 0.695105 |
| 2-3 | 137.9 | 0.0430726 | 0.199594 |
| 2-4 | 95.7 | 0.78005 | 0.91504 |
| 2-5 | 147.1 | 0.0152162 | 0.0963144 |
| 2-6 | 169.3 | 0.000967788 | 0.0110027 |
| 2-6-5 | 152.8 | 0.0110845 | 0.0768044 |
| 3-1 | 97.2 | 0.856939 | 0.943125 |
| 3-2 | 2.3 | 0 | 0 |
| 3-3 | 118.4 | 0.4322 | 0.736691 |
| 3-4 | 163 | 0.00604961 | 0.0472273 |
| 3-5 | 140.3 | 0.0332365 | 0.169217 |
| 4-1 | 115.7 | 0.358863 | 0.677787 |
| 4-1-1 | 164.7 | 0.0050447 | 0.0410232 |
| 4-2 | 98.8 | 0.94053 | 0.970217 |
| 4-3 | 112.9 | 0.443175 | 0.743492 |
| 4-3-2 | 123.2 | 0.187912 | 0.471591 |
| 4-4 | 137.8 | 0.0707259 | 0.267161 |
| 5-1 | 172.9 | 0.000608575 | 0.00766281 |
| 5-2 | 137 | 0.0477127 | 0.209957 |
| 5-3 | 151 | 0.0555776 | 0.22916 |
| 5-4 | 131.7 | 0.120513 | 0.358197 |
| 5-5 | 136.3 | 0.0512036 | 0.220206 |
| 6-1 | 140 | 0.0438551 | 0.201389 |
| 6-2 | 154.3 | 0.00646587 | 0.0496695 |
| 6-2-2 | 318.7 | 0.000793707 | 0.00948399 |
| 6-3 | 80.3 | 0.216398 | 0.519154 |
| 6-4 | 126.9 | 0.133539 | 0.380473 |
| 7-1 | 102.3 | 0.899043 | 0.95394 |
| 7-2 | 111.4 | 0.496148 | 0.776104 |
| 7-3 | 12 | 7.99e-16 | 8.51e-14 |
| 7-4 | 88.4 | 0.436105 | 0.741151 |
| 7-4-1 | 91 | 0.553638 | 0.812146 |
| 7-5 | 123.1 | 0.160754 | 0.432742 |
| 7-5-5 | 99.3 | 0.969555 | 0.98591 |
| 8-1 | 117.2 | 0.369544 | 0.686748 |
| 8-1-1 | 93.7 | 0.680525 | 0.882416 |
| 8-1-5 | 93.7 | 0.762182 | 0.912306 |
| 8-2 | 96.8 | 0.83768 | 0.935767 |
| 8-2-1 | 108.4 | 0.612413 | 0.849687 |
| 8-3 | 109.8 | 0.554399 | 0.812146 |
| 8-3-1 | 156.6 | 0.00490514 | 0.040428 |
| 9-1 | 113.6 | 0.421668 | 0.731798 |
| 9-1-2 | 114.6 | 0.442179 | 0.743492 |
| 9-1-3 | 102.8 | 0.896862 | 0.95394 |
| 9-2 | 109.6 | 0.563963 | 0.818 |
| 9-2-5 | 145 | 0.0195365 | 0.114961 |
| 9-2-6 | 131.4 | 0.0856521 | 0.294131 |
| 9-3 | 132.1 | 0.0796282 | 0.283088 |
| 9-3-1 | 137.6 | 0.0971017 | 0.31585 |
| 9-3-2 | 158.3 | 0.00393709 | 0.0344055 |
| 10-1 | 166.9 | 0.00223542 | 0.0219973 |
| 10-1-1 | 132.1 | 0.194679 | 0.482986 |
| 10-2 | 109.2 | 0.598074 | 0.841481 |
| 10-2-2 | 71.5 | 0.0351849 | 0.175326 |
| 10-3 | 142.1 | 0.0272679 | 0.148515 |
| 11-1 | 157.3 | 0.0108452 | 0.0755939 |
| 11-2 | 154.7 | 0.00616442 | 0.0478049 |
| 11-3 | 114.3 | 0.420966 | 0.731798 |
| 11-4 | 159.7 | 0.00329691 | 0.0293006 |
| 11-4-1 | 160 | 0.00826393 | 0.060106 |
| 12-1 | 195.4 | 2.94e-05 | 0.000537388 |
| 12-1-1 | 169 | 0.00101755 | 0.011375 |
| 12-2 | 19.6 | 3.28e-22 | 4.27e-20 |
| 12-3 | 82.4 | 0.223626 | 0.529021 |
| 12-3-1 | 115.4 | 0.36593 | 0.685606 |
| 12-4 | 44.6 | 0.000191293 | 0.00276548 |
| 12-4-1 | 143.6 | 0.0229726 | 0.129332 |
* Note
- A value of zero means the trans-lycopene concentration wasbelow the level of dection
- No measure of trans-lycopene was performed on lines notshown in the figure and table
|
|


