 |
 |
 |
 |
 |
 |
 |
 |
 |
 |
 |
 |
| Relative 1-penten-3-ol level (percent of control)* Experiment: flavor related metabolite profiling in S. habrochaites IL lines (FL, Spring 2003, Field) |
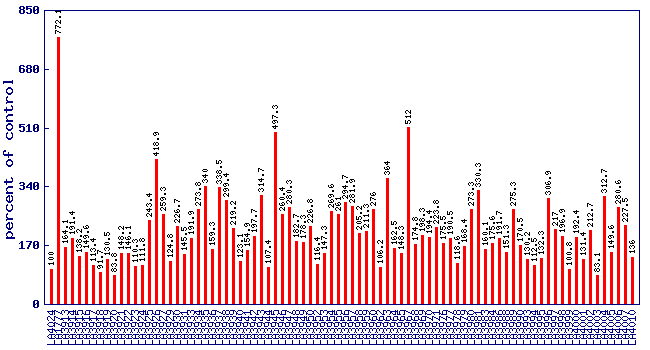 |
| line | relative level (percent of control) |
|---|---|
| LA4024 | 100 |
| LA1777 | 772.1 |
| LA3913 | 164.1 |
| LA3914 | 191.4 |
| LA3915 | 138.2 |
| LA3916 | 149.6 |
| LA3917 | 113.4 |
| LA3918 | 91.7 |
| LA3919 | 130.5 |
| LA3920 | 83.8 |
| LA3921 | 148.2 |
| LA3922 | 146.1 |
| LA3923 | 110.3 |
| LA3924 | 111.8 |
| LA3925 | 243.4 |
| LA3926 | 418.9 |
| LA3927 | 259.3 |
| LA3929 | 124.8 |
| LA3930 | 226.7 |
| LA3931 | 145.5 |
| LA3933 | 191.9 |
| LA3934 | 273.8 |
| LA3935 | 340 |
| LA3936 | 159.3 |
| LA3937 | 338.5 |
| LA3938 | 299.4 |
| LA3939 | 219.2 |
| LA3940 | 123.1 |
| LA3941 | 154.9 |
| LA3942 | 197.7 |
| LA3943 | 314.7 |
| LA3944 | 107.4 |
| LA3945 | 497.3 |
| LA3946 | 260.4 |
| LA3947 | 280.3 |
| LA3948 | 182.7 |
| LA3949 | 178.3 |
| LA3950 | 226.8 |
| LA3952 | 116.4 |
| LA3953 | 147.3 |
| LA3954 | 269.6 |
| LA3955 | 261 |
| LA3956 | 294.7 |
| LA3957 | 281.9 |
| LA3958 | 205.2 |
| LA3959 | 211.3 |
| LA3960 | 276 |
| LA3962 | 106.2 |
| LA3963 | 364 |
| LA3964 | 162.5 |
| LA3965 | 148.3 |
| LA3967 | 512 |
| LA3968 | 174.8 |
| LA3969 | 198.3 |
| LA3970 | 194.4 |
| LA3971 | 223.8 |
| LA3976 | 175.5 |
| LA3977 | 190.5 |
| LA3978 | 118.6 |
| LA3979 | 168.4 |
| LA3980 | 273.3 |
| LA3981 | 330.3 |
| LA3983 | 160.1 |
| LA3984 | 175.6 |
| LA3986 | 191.7 |
| LA3988 | 151.3 |
| LA3989 | 275.3 |
| LA3990 | 170.5 |
| LA3993 | 130.2 |
| LA3994 | 112.5 |
| LA3995 | 132.3 |
| LA3996 | 306.9 |
| LA3997 | 217 |
| LA3998 | 196.9 |
| LA3999 | 100.8 |
| LA4000 | 192.4 |
| LA4001 | 131.4 |
| LA4002 | 212.7 |
| LA4003 | 83.1 |
| LA4004 | 312.7 |
| LA4005 | 149.6 |
| LA4006 | 280.6 |
| LA4007 | 227.5 |
| LA4010 | 136 |
* Note
|