 |
 |
 |
 |
 |
 |
 |
 |
 |
 |
 |
 |
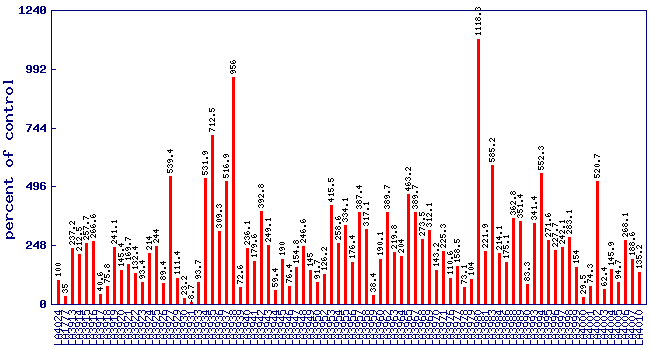
| Relative 2-isobutylthiazole level (percent of control)* Experiment: flavor related metabolite profiling in S. habrochaites IL lines (FL, Spring 2003, Field) |
 |
| line | relative level (percent of control) |
|---|---|
| LA4024 | 100 |
| LA1777 | 35 |
| LA3913 | 237.2 |
| LA3914 | 212.5 |
| LA3915 | 257.7 |
| LA3916 | 266.6 |
| LA3917 | 40.6 |
| LA3918 | 75.8 |
| LA3919 | 241.1 |
| LA3920 | 145.4 |
| LA3921 | 169.7 |
| LA3922 | 132.4 |
| LA3923 | 93.4 |
| LA3924 | 214 |
| LA3925 | 244 |
| LA3926 | 89.4 |
| LA3927 | 539.4 |
| LA3929 | 111.4 |
| LA3930 | 23.2 |
| LA3931 | 8.7 |
| LA3933 | 93.7 |
| LA3934 | 531.9 |
| LA3935 | 712.5 |
| LA3936 | 309.3 |
| LA3937 | 516.9 |
| LA3938 | 956 |
| LA3939 | 72.6 |
| LA3940 | 236.1 |
| LA3941 | 179.6 |
| LA3942 | 392.8 |
| LA3943 | 249.1 |
| LA3944 | 59.4 |
| LA3945 | 190 |
| LA3946 | 76.4 |
| LA3947 | 154.8 |
| LA3948 | 246.6 |
| LA3949 | 145 |
| LA3950 | 91.7 |
| LA3952 | 126.2 |
| LA3953 | 415.5 |
| LA3954 | 258.6 |
| LA3955 | 334.1 |
| LA3956 | 176.4 |
| LA3957 | 387.4 |
| LA3958 | 317.1 |
| LA3959 | 38.4 |
| LA3960 | 190.1 |
| LA3962 | 389.7 |
| LA3963 | 219.8 |
| LA3964 | 204 |
| LA3965 | 463.2 |
| LA3967 | 389.7 |
| LA3968 | 273.5 |
| LA3969 | 312.1 |
| LA3970 | 143.2 |
| LA3971 | 225.3 |
| LA3976 | 110.6 |
| LA3977 | 158.5 |
| LA3978 | 73.1 |
| LA3979 | 104 |
| LA3980 | 1118.3 |
| LA3981 | 221.9 |
| LA3983 | 585.2 |
| LA3984 | 214.1 |
| LA3986 | 175.1 |
| LA3988 | 362.8 |
| LA3989 | 351.4 |
| LA3990 | 83.3 |
| LA3993 | 341.4 |
| LA3994 | 552.3 |
| LA3995 | 271.6 |
| LA3996 | 227.7 |
| LA3997 | 242.1 |
| LA3998 | 283.1 |
| LA3999 | 154 |
| LA4000 | 29.5 |
| LA4001 | 74.3 |
| LA4002 | 520.7 |
| LA4003 | 62.4 |
| LA4004 | 145.9 |
| LA4005 | 94.7 |
| LA4006 | 268.1 |
| LA4007 | 188.6 |
| LA4010 | 135.2 |
* Note
|