 |
 |
 |
 |
 |
 |
 |
 |
 |
 |
 |
 |
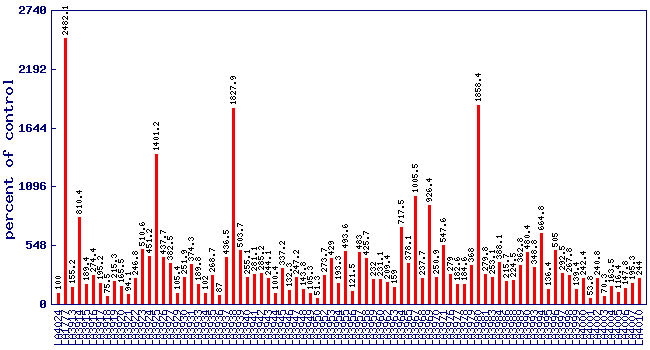
| Relative 2-methylbutanal level (percent of control)* Experiment: flavor related metabolite profiling in S. habrochaites IL lines (FL, Spring 2003, Field) |
 |
| line | relative level (percent of control) |
|---|---|
| LA4024 | 100 |
| LA1777 | 2482.1 |
| LA3913 | 155.2 |
| LA3914 | 810.4 |
| LA3915 | 189.4 |
| LA3916 | 274.4 |
| LA3917 | 195.2 |
| LA3918 | 75.5 |
| LA3919 | 215.3 |
| LA3920 | 165.5 |
| LA3921 | 94.1 |
| LA3922 | 246.8 |
| LA3923 | 510.6 |
| LA3924 | 451.2 |
| LA3925 | 1401.2 |
| LA3926 | 437.7 |
| LA3927 | 382.5 |
| LA3929 | 105.4 |
| LA3930 | 251.9 |
| LA3931 | 374.3 |
| LA3933 | 189.8 |
| LA3934 | 102 |
| LA3935 | 268.7 |
| LA3936 | 87 |
| LA3937 | 436.5 |
| LA3938 | 1827.9 |
| LA3939 | 503.7 |
| LA3940 | 255.1 |
| LA3941 | 281.1 |
| LA3942 | 285.2 |
| LA3943 | 244.1 |
| LA3944 | 100.4 |
| LA3945 | 337.2 |
| LA3946 | 132.3 |
| LA3947 | 247.2 |
| LA3948 | 143.8 |
| LA3949 | 105.3 |
| LA3950 | 51.3 |
| LA3952 | 273.7 |
| LA3953 | 429 |
| LA3954 | 193.3 |
| LA3955 | 493.6 |
| LA3956 | 121.5 |
| LA3957 | 483 |
| LA3958 | 425.7 |
| LA3959 | 232 |
| LA3960 | 231.1 |
| LA3962 | 209.4 |
| LA3963 | 159 |
| LA3964 | 717.5 |
| LA3965 | 378.1 |
| LA3967 | 1005.5 |
| LA3968 | 237.7 |
| LA3969 | 926.4 |
| LA3970 | 250.9 |
| LA3971 | 547.6 |
| LA3976 | 279 |
| LA3977 | 182.6 |
| LA3978 | 184.6 |
| LA3979 | 368 |
| LA3980 | 1858.4 |
| LA3981 | 279.8 |
| LA3983 | 253.1 |
| LA3984 | 388.1 |
| LA3986 | 215.7 |
| LA3988 | 224.5 |
| LA3989 | 362.8 |
| LA3990 | 480.4 |
| LA3993 | 348.8 |
| LA3994 | 664.8 |
| LA3995 | 136.4 |
| LA3996 | 505 |
| LA3997 | 292.5 |
| LA3998 | 267.8 |
| LA3999 | 139.4 |
| LA4000 | 242.4 |
| LA4001 | 53.8 |
| LA4002 | 240.8 |
| LA4003 | 70.3 |
| LA4004 | 163.5 |
| LA4005 | 116.4 |
| LA4006 | 147.8 |
| LA4007 | 195.3 |
| LA4010 | 244 |
* Note
|