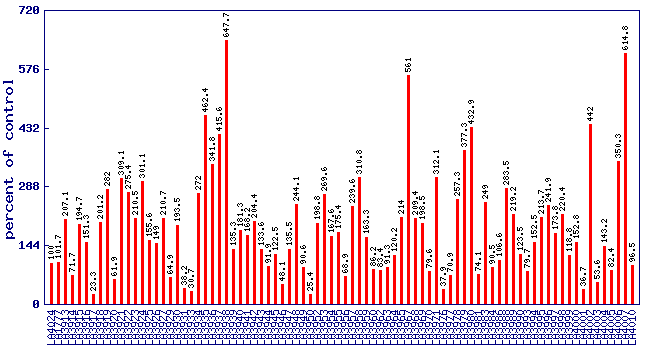
Relative 3-methyl-1-butanol level (percent of control)
*
Experiment: flavor related metabolite profiling in S. habrochaites IL lines (FL, Spring 2003, Field)
line
relative level (percent of control)
LA4024
100
LA1777
101.7
LA3913
207.1
LA3914
71.7
LA3915
194.7
LA3916
151.3
LA3917
23.3
LA3918
201.2
LA3919
282
LA3920
61.9
LA3921
309.1
LA3922
275.4
LA3923
210.5
LA3924
301.1
LA3925
155.6
LA3926
149
LA3927
210.7
LA3929
64.9
LA3930
193.5
LA3931
38.2
LA3933
30.7
LA3934
272
LA3935
462.4
LA3936
341.8
LA3937
415.6
LA3938
647.7
LA3939
135.3
LA3940
181.3
LA3941
168.2
LA3942
204.4
LA3943
133.6
LA3944
91.9
LA3945
122.5
LA3946
48.1
LA3947
135.5
LA3948
244.1
LA3949
90.6
LA3950
25.4
LA3952
198.8
LA3953
269.6
LA3954
167.6
LA3955
175.4
LA3956
68.9
LA3957
239.6
LA3958
310.8
LA3959
163.3
LA3960
86.2
LA3962
83.4
LA3963
91.3
LA3964
120.2
LA3965
214
LA3967
561
LA3968
209.4
LA3969
198.5
LA3970
79.6
LA3971
312.1
LA3976
37.9
LA3977
70.9
LA3978
257.3
LA3979
377.3
LA3980
432.9
LA3981
74.1
LA3983
249
LA3984
90.5
LA3986
106.6
LA3988
283.5
LA3989
219.2
LA3990
123.5
LA3993
79.7
LA3994
152.5
LA3995
213.7
LA3996
241.9
LA3997
173.8
LA3998
220.4
LA3999
118.8
LA4000
152.8
LA4001
36.7
LA4002
442
LA4003
53.6
LA4004
143.2
LA4005
82.4
LA4006
350.3
LA4007
614.8
LA4010
96.5
* Note
A value of zero means the 3-methyl-1-butanol concentration wasbelow the level of dection
No measure of 3-methyl-1-butanol was performed on lines notshown in the figure and table