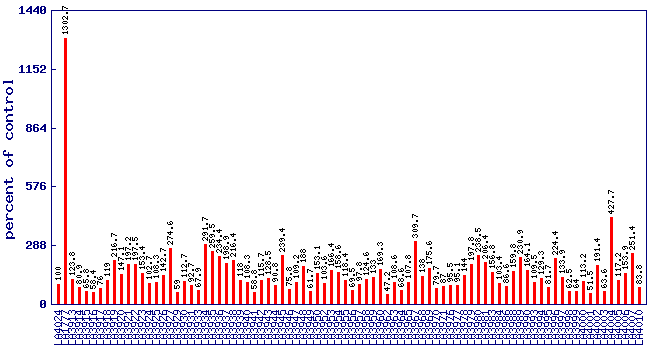
Relative cis-2-penten-1-ol level (percent of control)
*
Experiment: flavor related metabolite profiling in S. habrochaites IL lines (FL, Spring 2003, Field)
line
relative level (percent of control)
LA4024
100
LA1777
1302.7
LA3913
123.8
LA3914
80.9
LA3915
65.8
LA3916
58.4
LA3917
76
LA3918
119
LA3919
216.7
LA3920
147.1
LA3921
197.2
LA3922
197.5
LA3923
153.4
LA3924
102.7
LA3925
108.3
LA3926
142.7
LA3927
274.6
LA3929
59
LA3930
112.7
LA3931
92.7
LA3933
67.9
LA3934
291.7
LA3935
259.5
LA3936
234.4
LA3937
198.9
LA3938
216.4
LA3939
118
LA3940
108.3
LA3941
58.8
LA3942
115.7
LA3943
128.5
LA3944
90.8
LA3945
239.4
LA3946
75.8
LA3947
109.2
LA3948
188
LA3949
61.7
LA3950
153.1
LA3952
103.6
LA3953
166.4
LA3954
158.6
LA3955
118.4
LA3956
69.5
LA3957
97.8
LA3958
124.6
LA3959
133
LA3960
169.3
LA3962
47.2
LA3963
108.6
LA3964
68.6
LA3965
107.8
LA3967
309.7
LA3968
138
LA3969
175.6
LA3970
79.7
LA3971
87
LA3976
95.5
LA3977
95.1
LA3978
144
LA3979
197.8
LA3980
238.5
LA3981
206.4
LA3983
156.8
LA3984
103.4
LA3986
86.6
LA3988
159.8
LA3989
230.9
LA3990
164.1
LA3993
109.5
LA3994
129.3
LA3995
81.7
LA3996
224.4
LA3997
133.9
LA3998
62.5
LA3999
64
LA4000
113.2
LA4001
51.5
LA4002
191.4
LA4003
63.6
LA4004
427.7
LA4005
117.2
LA4006
153.9
LA4007
251.4
LA4010
83.8
* Note
A value of zero means the cis-2-penten-1-ol concentration wasbelow the level of dection
No measure of cis-2-penten-1-ol was performed on lines notshown in the figure and table