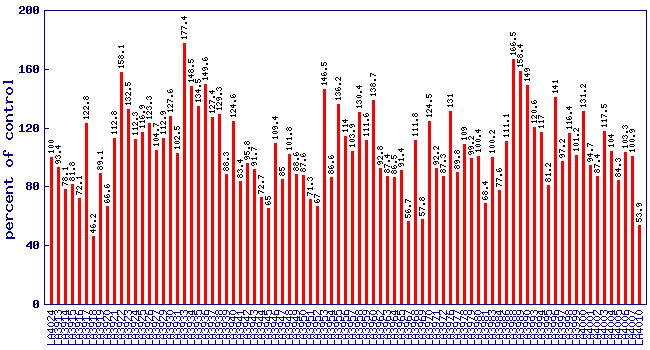
Relative citric acid level (percent of control)
*
Experiment: flavor related metabolite profiling in S. habrochaites IL lines (FL, Spring 2003, Field)
line
relative level (percent of control)
LA4024
100
LA3913
93.4
LA3914
78.1
LA3915
81.8
LA3916
72.1
LA3917
122.8
LA3918
46.2
LA3919
89.1
LA3920
66.6
LA3921
112.8
LA3922
158.1
LA3923
132.5
LA3924
112.3
LA3925
116.9
LA3926
123.3
LA3927
104.7
LA3929
112.9
LA3930
127.6
LA3931
102.5
LA3933
177.4
LA3934
148.5
LA3935
134.5
LA3936
149.6
LA3937
127.4
LA3938
129.3
LA3939
88.3
LA3940
124.6
LA3941
83.4
LA3942
95.8
LA3943
91.7
LA3944
72.7
LA3945
65
LA3946
109.4
LA3947
85
LA3948
101.8
LA3949
88.6
LA3950
87.6
LA3951
71.3
LA3952
67
LA3953
146.5
LA3954
86.6
LA3955
136.2
LA3956
114
LA3957
103.9
LA3958
130.4
LA3959
111.6
LA3960
138.7
LA3962
92.8
LA3963
87.4
LA3964
86.5
LA3965
91.4
LA3967
56.7
LA3968
111.8
LA3969
57.8
LA3970
124.5
LA3971
92.2
LA3972
87.3
LA3976
131
LA3977
89.8
LA3978
109
LA3979
99.2
LA3980
100.4
LA3981
68.4
LA3983
100.2
LA3984
77.6
LA3986
111.1
LA3988
166.5
LA3989
158.4
LA3990
149
LA3993
120.6
LA3994
117
LA3995
81.2
LA3996
141
LA3997
97.2
LA3998
116.4
LA3999
101.2
LA4000
131.2
LA4001
94.7
LA4002
87.4
LA4003
117.5
LA4004
104
LA4005
84.3
LA4006
103.3
LA4007
100.9
LA4010
53.9
* Note
A value of zero means the citric acid concentration wasbelow the level of dection
No measure of citric acid was performed on lines notshown in the figure and table