 |
 |
 |
 |
 |
 |
 |
 |
 |
 |
 |
 |
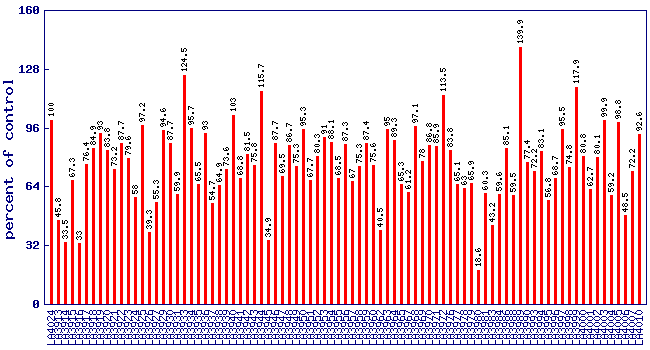
| Relative malic acid level (percent of control)* Experiment: flavor related metabolite profiling in S. habrochaites IL lines (FL, Spring 2003, Field) |
 |
| line | relative level (percent of control) |
|---|---|
| LA4024 | 100 |
| LA3913 | 45.8 |
| LA3914 | 33.5 |
| LA3915 | 67.3 |
| LA3916 | 33 |
| LA3917 | 76.4 |
| LA3918 | 84.9 |
| LA3919 | 93 |
| LA3920 | 83.8 |
| LA3921 | 73.2 |
| LA3922 | 87.7 |
| LA3923 | 79.6 |
| LA3924 | 58 |
| LA3925 | 97.2 |
| LA3926 | 39.3 |
| LA3927 | 55.3 |
| LA3929 | 94.6 |
| LA3930 | 87.7 |
| LA3931 | 59.9 |
| LA3933 | 124.5 |
| LA3934 | 95.7 |
| LA3935 | 65.5 |
| LA3936 | 93 |
| LA3937 | 54.7 |
| LA3938 | 64.9 |
| LA3939 | 73.6 |
| LA3940 | 103 |
| LA3941 | 68.8 |
| LA3942 | 81.5 |
| LA3943 | 75.8 |
| LA3944 | 115.7 |
| LA3945 | 34.9 |
| LA3946 | 87.7 |
| LA3947 | 69.5 |
| LA3948 | 86.7 |
| LA3949 | 75.3 |
| LA3950 | 95.3 |
| LA3951 | 67.7 |
| LA3952 | 80.3 |
| LA3953 | 91 |
| LA3954 | 88.1 |
| LA3955 | 68.5 |
| LA3956 | 87.3 |
| LA3957 | 67 |
| LA3958 | 75.3 |
| LA3959 | 87.4 |
| LA3960 | 75.6 |
| LA3962 | 40.5 |
| LA3963 | 95 |
| LA3964 | 89.3 |
| LA3965 | 65.3 |
| LA3967 | 61.2 |
| LA3968 | 97.1 |
| LA3969 | 78 |
| LA3970 | 86.8 |
| LA3971 | 85.9 |
| LA3972 | 113.5 |
| LA3976 | 83.8 |
| LA3977 | 65.1 |
| LA3978 | 63 |
| LA3979 | 65.9 |
| LA3980 | 18.6 |
| LA3981 | 60.3 |
| LA3983 | 43.2 |
| LA3984 | 59.6 |
| LA3986 | 85.1 |
| LA3988 | 59.5 |
| LA3989 | 139.9 |
| LA3990 | 77.4 |
| LA3993 | 72.2 |
| LA3994 | 83.1 |
| LA3995 | 56.8 |
| LA3996 | 68.7 |
| LA3997 | 95.5 |
| LA3998 | 74.8 |
| LA3999 | 117.9 |
| LA4000 | 80.8 |
| LA4001 | 62.7 |
| LA4002 | 80.1 |
| LA4003 | 99.9 |
| LA4004 | 59.2 |
| LA4005 | 98.8 |
| LA4006 | 48.5 |
| LA4007 | 72.2 |
| LA4010 | 92.6 |
* Note
|