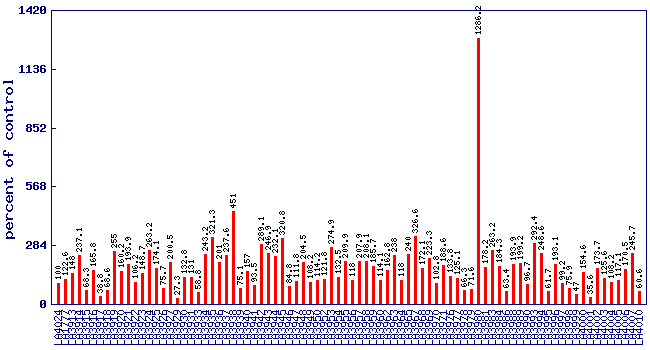
Relative methional level (percent of control)
*
Experiment: flavor related metabolite profiling in S. habrochaites IL lines (FL, Spring 2003, Field)
line
relative level (percent of control)
LA4024
100
LA1777
122.6
LA3913
148
LA3914
237.1
LA3915
68.3
LA3916
165.8
LA3917
38.8
LA3918
68.6
LA3919
255
LA3920
160.2
LA3921
193.9
LA3922
106.2
LA3923
148.7
LA3924
263.2
LA3925
174.1
LA3926
75.7
LA3927
200.5
LA3929
27.3
LA3930
132.8
LA3931
131
LA3933
58.8
LA3934
243.2
LA3935
321.3
LA3936
201
LA3937
237.6
LA3938
451
LA3939
75.1
LA3940
157
LA3941
93.5
LA3942
289.1
LA3943
246.9
LA3944
232.1
LA3945
320.8
LA3946
84.8
LA3947
111.8
LA3948
204.5
LA3949
108.2
LA3950
114.2
LA3952
121.8
LA3953
274.9
LA3954
132.5
LA3955
209.9
LA3956
118
LA3957
207.9
LA3958
208.1
LA3959
185.7
LA3960
114.1
LA3962
162.8
LA3963
238
LA3964
118
LA3965
240
LA3967
326.6
LA3968
172.1
LA3969
223.3
LA3970
102.8
LA3971
188.6
LA3976
133.8
LA3977
125.1
LA3978
66.3
LA3979
71.6
LA3980
1286.2
LA3981
178.2
LA3983
263.2
LA3984
184.3
LA3986
63.4
LA3988
193.9
LA3989
199.2
LA3990
96.7
LA3993
292.4
LA3994
248.6
LA3995
61.7
LA3996
193.1
LA3997
99.2
LA3998
75.9
LA3999
47
LA4000
154.6
LA4001
35.6
LA4002
173.7
LA4003
125.6
LA4004
108.2
LA4005
117.1
LA4006
170.5
LA4007
245.7
LA4010
60.6
* Note
A value of zero means the methional concentration wasbelow the level of dection
No measure of methional was performed on lines notshown in the figure and table