Relative methyl benzoate level (percent of control)
*
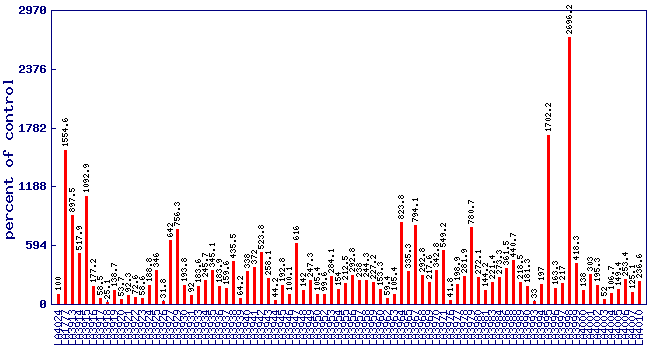
Experiment: flavor related metabolite profiling in S. habrochaites IL lines (FL, Spring 2003, Field)
line
relative level (percent of control)
LA4024
100
LA1777
1554.6
LA3913
897.5
LA3914
517.9
LA3915
1092.9
LA3916
177.2
LA3917
58.5
LA3918
25.1
LA3919
138.7
LA3920
53.7
LA3921
92.3
LA3922
72.6
LA3923
58.6
LA3924
188.8
LA3925
346
LA3926
31.8
LA3927
642
LA3929
756.3
LA3930
193.8
LA3931
92
LA3933
183.6
LA3934
245.7
LA3935
345.1
LA3936
183.9
LA3937
159.6
LA3938
435.5
LA3939
64.2
LA3940
338
LA3941
372
LA3942
523.8
LA3943
258.1
LA3944
44.2
LA3945
192.8
LA3946
100.1
LA3947
616
LA3948
142
LA3949
247.3
LA3950
105.4
LA3952
99.6
LA3953
284.1
LA3954
154
LA3955
212.5
LA3956
292.8
LA3957
238
LA3958
244.3
LA3959
227.2
LA3960
153.3
LA3962
59.4
LA3963
105.4
LA3964
823.8
LA3965
335.3
LA3967
794.1
LA3968
292.8
LA3969
217.6
LA3970
342.8
LA3971
549.2
LA3976
41.8
LA3977
198.9
LA3978
281.9
LA3979
780.7
LA3980
272.1
LA3981
144.2
LA3983
221.4
LA3984
273.3
LA3986
361.5
LA3988
440.7
LA3989
218.5
LA3990
181.3
LA3993
33
LA3994
197
LA3995
1702.2
LA3996
163.3
LA3997
217
LA3998
2696.2
LA3999
418.3
LA4000
138
LA4001
303
LA4002
195.3
LA4003
52
LA4004
106.7
LA4005
149.4
LA4006
253.4
LA4007
125.1
LA4010
236.6
* Note
A value of zero means the methyl benzoate concentration wasbelow the level of dection
No measure of methyl benzoate was performed on lines notshown in the figure and table