 |
 |
 |
 |
 |
 |
 |
 |
 |
 |
 |
 |
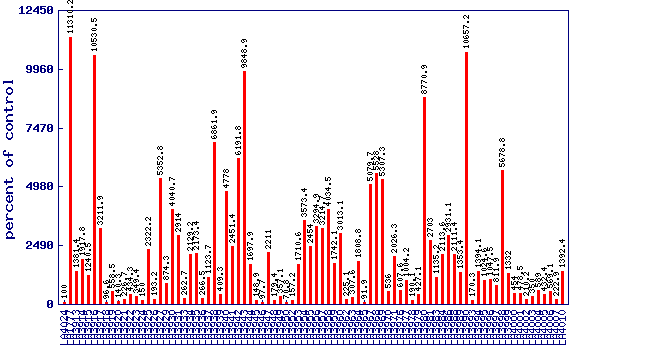
| Relative phenylacetaldehyde level (percent of control)* Experiment: flavor related metabolite profiling in S. habrochaites IL lines (FL, Spring 2003, Field) |
 |
| line | relative level (percent of control) |
|---|---|
| LA4024 | 100 |
| LA1777 | 11310.2 |
| LA3913 | 1381.4 |
| LA3914 | 1917.8 |
| LA3915 | 1240.5 |
| LA3916 | 10530.5 |
| LA3917 | 3211.9 |
| LA3918 | 96.6 |
| LA3919 | 558.5 |
| LA3920 | 140.3 |
| LA3921 | 226.7 |
| LA3922 | 434.3 |
| LA3923 | 349.4 |
| LA3924 | 150 |
| LA3925 | 2322.2 |
| LA3926 | 193.2 |
| LA3927 | 5352.8 |
| LA3929 | 874.3 |
| LA3930 | 4040.7 |
| LA3931 | 2914 |
| LA3933 | 262.7 |
| LA3934 | 2129.2 |
| LA3935 | 2173.4 |
| LA3936 | 266.5 |
| LA3937 | 1123.7 |
| LA3938 | 6861.9 |
| LA3939 | 409.3 |
| LA3940 | 4778 |
| LA3941 | 2451.4 |
| LA3942 | 6191.8 |
| LA3943 | 9848.9 |
| LA3944 | 1697.9 |
| LA3945 | 148.9 |
| LA3946 | 97.7 |
| LA3947 | 2211 |
| LA3948 | 179.4 |
| LA3949 | 357.1 |
| LA3950 | 70.8 |
| LA3952 | 157.2 |
| LA3953 | 1710.6 |
| LA3954 | 3573.4 |
| LA3955 | 2454 |
| LA3956 | 3294.9 |
| LA3957 | 3214.7 |
| LA3958 | 4034.5 |
| LA3959 | 1742.1 |
| LA3960 | 3013.1 |
| LA3962 | 225.1 |
| LA3963 | 307.6 |
| LA3964 | 1808.8 |
| LA3965 | 91.9 |
| LA3967 | 5079.7 |
| LA3968 | 5528 |
| LA3969 | 5307.3 |
| LA3970 | 536 |
| LA3971 | 2026.3 |
| LA3976 | 607.6 |
| LA3977 | 1004.2 |
| LA3978 | 190.1 |
| LA3979 | 427.1 |
| LA3980 | 8770.9 |
| LA3981 | 2703 |
| LA3983 | 1135.2 |
| LA3984 | 2113.6 |
| LA3986 | 2931.1 |
| LA3988 | 2111.4 |
| LA3989 | 1353.4 |
| LA3990 | 10657.2 |
| LA3993 | 170.3 |
| LA3994 | 1394.1 |
| LA3995 | 1024.6 |
| LA3996 | 1047.5 |
| LA3997 | 811.9 |
| LA3998 | 5678.8 |
| LA3999 | 1332 |
| LA4000 | 454 |
| LA4001 | 478.5 |
| LA4002 | 210.2 |
| LA4003 | 350 |
| LA4004 | 589 |
| LA4005 | 432.4 |
| LA4006 | 569.1 |
| LA4007 | 222.9 |
| LA4010 | 1392.4 |
* Note
|