 |
 |
 |
 |
 |
 |
 |
 |
 |
 |
 |
 |
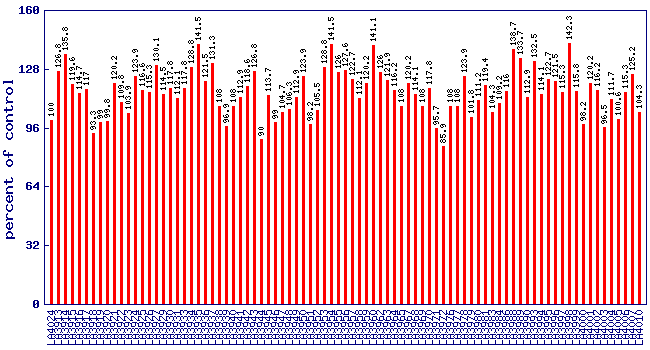
| Relative soluble solids level (percent of control)* Experiment: flavor related metabolite profiling in S. habrochaites IL lines (FL, Spring 2003, Field) |
 |
| line | relative level (percent of control) |
|---|---|
| LA4024 | 100 |
| LA3913 | 126.8 |
| LA3914 | 135.8 |
| LA3915 | 119.6 |
| LA3916 | 114.7 |
| LA3917 | 117 |
| LA3918 | 93.3 |
| LA3919 | 99 |
| LA3920 | 99.8 |
| LA3921 | 120.2 |
| LA3922 | 109.8 |
| LA3923 | 103.9 |
| LA3924 | 123.9 |
| LA3925 | 116.6 |
| LA3926 | 115.3 |
| LA3927 | 130.1 |
| LA3929 | 114.5 |
| LA3930 | 117.8 |
| LA3931 | 112.1 |
| LA3933 | 117.8 |
| LA3934 | 128.8 |
| LA3935 | 141.5 |
| LA3936 | 121.5 |
| LA3937 | 131.3 |
| LA3938 | 108 |
| LA3939 | 96.9 |
| LA3940 | 108 |
| LA3941 | 112.9 |
| LA3942 | 118.6 |
| LA3943 | 126.8 |
| LA3944 | 90 |
| LA3945 | 113.7 |
| LA3946 | 99 |
| LA3947 | 104.7 |
| LA3948 | 106.3 |
| LA3949 | 112.9 |
| LA3950 | 123.9 |
| LA3951 | 98.2 |
| LA3952 | 105.5 |
| LA3953 | 128.8 |
| LA3954 | 141.5 |
| LA3955 | 126 |
| LA3956 | 127.6 |
| LA3957 | 122.7 |
| LA3958 | 112.1 |
| LA3959 | 120.2 |
| LA3960 | 141.1 |
| LA3962 | 126 |
| LA3963 | 121.9 |
| LA3964 | 116.2 |
| LA3965 | 108 |
| LA3967 | 120.2 |
| LA3968 | 114.1 |
| LA3969 | 108 |
| LA3970 | 117.8 |
| LA3971 | 95.7 |
| LA3972 | 85.9 |
| LA3976 | 108 |
| LA3977 | 108 |
| LA3978 | 123.9 |
| LA3979 | 101.8 |
| LA3980 | 111.2 |
| LA3981 | 119.4 |
| LA3983 | 104.3 |
| LA3984 | 109.2 |
| LA3986 | 116 |
| LA3988 | 138.7 |
| LA3989 | 133.7 |
| LA3990 | 112.9 |
| LA3993 | 132.5 |
| LA3994 | 114.1 |
| LA3995 | 122.7 |
| LA3996 | 121.5 |
| LA3997 | 115.3 |
| LA3998 | 142.3 |
| LA3999 | 115.8 |
| LA4000 | 98.2 |
| LA4001 | 120.2 |
| LA4002 | 116.2 |
| LA4003 | 96.5 |
| LA4004 | 111.7 |
| LA4005 | 100.6 |
| LA4006 | 115.3 |
| LA4007 | 125.2 |
| LA4010 | 104.3 |
* Note
|