 |
 |
 |
 |
 |
 |
 |
 |
 |
 |
 |
 |
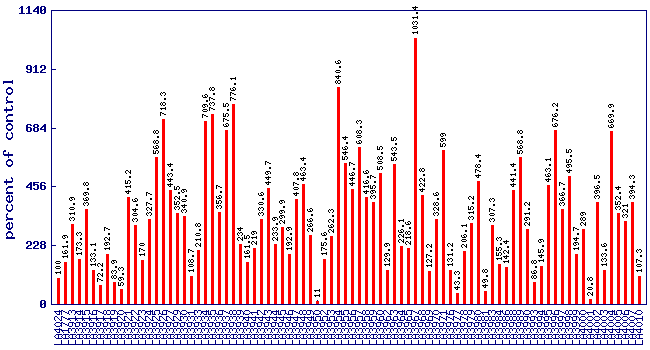
| Relative trans-2-pentenal level (percent of control)* Experiment: flavor related metabolite profiling in S. habrochaites IL lines (FL, Spring 2003, Field) |
 |
| line | relative level (percent of control) |
|---|---|
| LA4024 | 100 |
| LA1777 | 161.9 |
| LA3913 | 310.9 |
| LA3914 | 173.3 |
| LA3915 | 369.8 |
| LA3916 | 133.1 |
| LA3917 | 72.2 |
| LA3918 | 192.7 |
| LA3919 | 83.9 |
| LA3920 | 59.3 |
| LA3921 | 415.2 |
| LA3922 | 304.6 |
| LA3923 | 170 |
| LA3924 | 327.7 |
| LA3925 | 568.8 |
| LA3926 | 718.3 |
| LA3927 | 443.4 |
| LA3929 | 352.5 |
| LA3930 | 340.9 |
| LA3931 | 108.7 |
| LA3933 | 210.8 |
| LA3934 | 709.6 |
| LA3935 | 737.8 |
| LA3936 | 356.7 |
| LA3937 | 675.5 |
| LA3938 | 776.1 |
| LA3939 | 234 |
| LA3940 | 161.5 |
| LA3941 | 219 |
| LA3942 | 330.6 |
| LA3943 | 449.7 |
| LA3944 | 233.9 |
| LA3945 | 299.9 |
| LA3946 | 192.9 |
| LA3947 | 407.8 |
| LA3948 | 463.4 |
| LA3949 | 266.6 |
| LA3950 | 11 |
| LA3952 | 175.6 |
| LA3953 | 262.3 |
| LA3954 | 840.6 |
| LA3955 | 546.4 |
| LA3956 | 446.7 |
| LA3957 | 608.3 |
| LA3958 | 416.6 |
| LA3959 | 395.7 |
| LA3960 | 508.5 |
| LA3962 | 129.9 |
| LA3963 | 543.5 |
| LA3964 | 226.1 |
| LA3965 | 218.6 |
| LA3967 | 1031.4 |
| LA3968 | 422.8 |
| LA3969 | 127.2 |
| LA3970 | 328.6 |
| LA3971 | 599 |
| LA3976 | 131.2 |
| LA3977 | 43.3 |
| LA3978 | 206.1 |
| LA3979 | 315.2 |
| LA3980 | 478.4 |
| LA3981 | 49.8 |
| LA3983 | 307.3 |
| LA3984 | 155.3 |
| LA3986 | 142.4 |
| LA3988 | 441.4 |
| LA3989 | 568.8 |
| LA3990 | 291.2 |
| LA3993 | 86.8 |
| LA3994 | 145.9 |
| LA3995 | 463.1 |
| LA3996 | 676.2 |
| LA3997 | 366.7 |
| LA3998 | 495.5 |
| LA3999 | 194.7 |
| LA4000 | 289 |
| LA4001 | 20.8 |
| LA4002 | 396.5 |
| LA4003 | 133.6 |
| LA4004 | 669.9 |
| LA4005 | 352.4 |
| LA4006 | 321 |
| LA4007 | 394.3 |
| LA4010 | 107.3 |
* Note
|