 |
 |
 |
 |
 |
 |
 |
 |
 |
 |
 |
 |
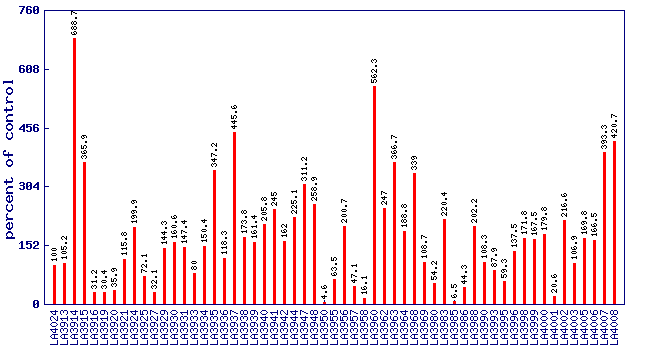
| Relative trans-2-pentenal level (percent of control)* Experiment: flavor related metabolite profiling in S. habrochaites IL lines (FL, Spring 2003, Greenhouse) |
 |
| line | relative level (percent of control) |
|---|---|
| LA4024 | 100 |
| LA3913 | 105.2 |
| LA3914 | 688.7 |
| LA3915 | 365.9 |
| LA3916 | 31.2 |
| LA3919 | 30.4 |
| LA3920 | 35.9 |
| LA3921 | 115.8 |
| LA3924 | 199.9 |
| LA3925 | 72.1 |
| LA3927 | 32.1 |
| LA3929 | 144.3 |
| LA3930 | 160.6 |
| LA3931 | 147.4 |
| LA3933 | 80 |
| LA3934 | 150.4 |
| LA3935 | 347.2 |
| LA3936 | 118.3 |
| LA3937 | 445.6 |
| LA3938 | 173.8 |
| LA3939 | 161.4 |
| LA3940 | 205.8 |
| LA3941 | 245 |
| LA3942 | 162 |
| LA3944 | 225.1 |
| LA3947 | 311.2 |
| LA3948 | 258.9 |
| LA3950 | 4.6 |
| LA3955 | 63.5 |
| LA3956 | 200.7 |
| LA3957 | 47.1 |
| LA3958 | 16.1 |
| LA3960 | 562.3 |
| LA3962 | 247 |
| LA3963 | 366.7 |
| LA3964 | 188.8 |
| LA3968 | 339 |
| LA3969 | 108.7 |
| LA3980 | 54.2 |
| LA3983 | 220.4 |
| LA3985 | 6.5 |
| LA3986 | 44.3 |
| LA3988 | 202.2 |
| LA3990 | 108.3 |
| LA3993 | 87.9 |
| LA3995 | 59.3 |
| LA3996 | 137.5 |
| LA3998 | 171.8 |
| LA3999 | 167.5 |
| LA4000 | 179.8 |
| LA4001 | 20.6 |
| LA4002 | 216.6 |
| LA4003 | 106.9 |
| LA4005 | 169.8 |
| LA4006 | 166.5 |
| LA4007 | 393.3 |
| LA4008 | 420.7 |
* Note
|