 |
 |
 |
 |
 |
 |
 |
 |
 |
 |
 |
 |
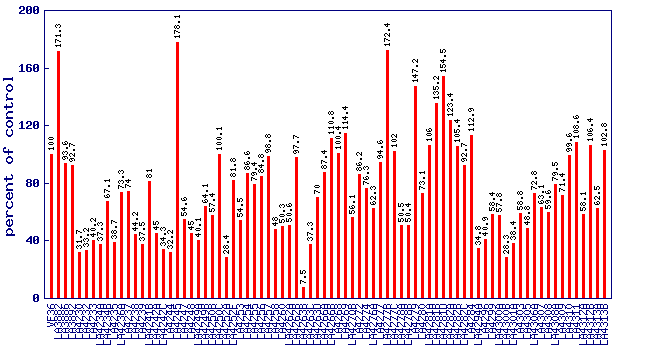
| Relative 1-nitro-2-phenylethane level (percent of control)* Experiment: flavor related metabolite profiling in S. lycopersicoides IL lines (FL, Fall 2015) |
 |
| line | relative level (percent of control) |
|---|---|
| VF36 | 100 |
| LA3882 | 171.3 |
| LA3886 | 93.6 |
| LA3892 | 92.7 |
| LA4230 | 31.7 |
| LA4232 | 33.2 |
| LA4233 | 40.2 |
| LA4234A | 37.3 |
| LA4234B | 67.1 |
| LA4235 | 38.7 |
| LA4236A | 73.3 |
| LA4237 | 74 |
| LA4238 | 44.2 |
| LA4239 | 37.5 |
| LA4241B | 81 |
| LA4242A | 45 |
| LA4242C | 34.3 |
| LA4244 | 32.2 |
| LA4245 | 178.1 |
| LA4247 | 54.6 |
| LA4248 | 45 |
| LA4249A | 40.1 |
| LA4249B | 64.1 |
| LA4250B | 57.4 |
| LA4250C | 100.1 |
| LA4252A | 28.4 |
| LA4252F | 81.8 |
| LA4253 | 54.5 |
| LA4254 | 86.6 |
| LA4255 | 79.4 |
| LA4256 | 84.8 |
| LA4257 | 98.8 |
| LA4258 | 48 |
| LA4260 | 50.3 |
| LA4262A | 50.6 |
| LA4262B | 97.7 |
| LA4263B | 7.5 |
| LA4263C | 37.3 |
| LA4263D | 70 |
| LA4266A | 87.4 |
| LA4266B | 110.8 |
| LA4268 | 100.4 |
| LA4269 | 114.4 |
| LA4270B | 56.1 |
| LA4272 | 86.2 |
| LA4274 | 76.3 |
| LA4276A | 62.3 |
| LA4277 | 94.6 |
| LA4277B | 172.4 |
| LA4277C | 102 |
| LA4278A | 50.5 |
| LA4278B | 50.4 |
| LA4279 | 147.2 |
| LA4280 | 73.1 |
| LA4281A | 106 |
| LA4281B | 135.2 |
| LA4281D | 154.5 |
| LA4282A | 123.4 |
| LA4282B | 105.4 |
| LA4282C | 92.7 |
| LA4284 | 112.9 |
| LA4294A | 34.8 |
| LA4296 | 40.9 |
| LA4299 | 58.4 |
| LA4300A | 57.8 |
| LA4300B | 28.3 |
| LA4301A | 38.4 |
| LA4303 | 58.8 |
| LA4305 | 48.8 |
| LA4306A | 72.8 |
| LA4307 | 63.1 |
| LA4308 | 59.6 |
| LA4308A | 79.5 |
| LA4309 | 71.4 |
| LA4310 | 99.6 |
| LA4311 | 108.6 |
| LA4312A | 58.1 |
| LA4312B | 106.4 |
| LA4313A | 62.5 |
| LA4313B | 102.8 |
* Note
|