 |
 |
 |
 |
 |
 |
 |
 |
 |
 |
 |
 |
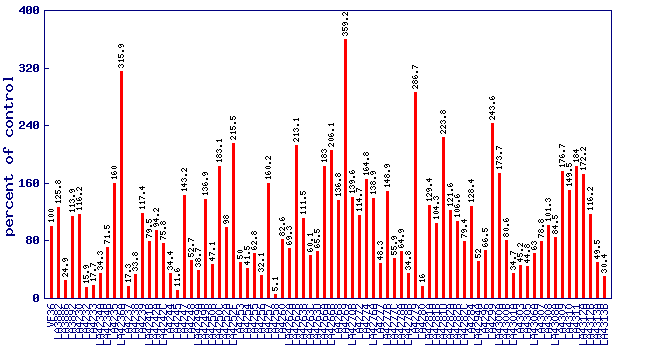
| Relative 1-pentanol level (percent of control)* Experiment: flavor related metabolite profiling in S. lycopersicoides IL lines (FL, Fall 2015) |
 |
| line | relative level (percent of control) |
|---|---|
| VF36 | 100 |
| LA3882 | 125.8 |
| LA3886 | 24.9 |
| LA3892 | 113.9 |
| LA4230 | 116.2 |
| LA4232 | 15.9 |
| LA4233 | 17.7 |
| LA4234A | 34.3 |
| LA4234B | 71.5 |
| LA4235 | 160 |
| LA4236A | 315.9 |
| LA4237 | 17.3 |
| LA4238 | 33.8 |
| LA4239 | 117.4 |
| LA4241B | 79.5 |
| LA4242A | 94.2 |
| LA4242C | 75.8 |
| LA4244 | 34.4 |
| LA4245 | 11.6 |
| LA4247 | 143.2 |
| LA4248 | 52.7 |
| LA4249A | 38.7 |
| LA4249B | 136.9 |
| LA4250B | 47.1 |
| LA4250C | 183.1 |
| LA4252A | 98 |
| LA4252F | 215.5 |
| LA4253 | 50 |
| LA4254 | 41.5 |
| LA4255 | 62.8 |
| LA4256 | 32.1 |
| LA4257 | 160.2 |
| LA4258 | 5.1 |
| LA4260 | 82.6 |
| LA4262A | 69.3 |
| LA4262B | 213.1 |
| LA4263B | 111.5 |
| LA4263C | 60.1 |
| LA4263D | 65.5 |
| LA4266A | 183 |
| LA4266B | 206.1 |
| LA4268 | 136.8 |
| LA4269 | 359.2 |
| LA4270B | 139.6 |
| LA4272 | 114.7 |
| LA4274 | 164.8 |
| LA4276A | 138.9 |
| LA4277 | 48.3 |
| LA4277B | 148.9 |
| LA4277C | 55.9 |
| LA4278A | 64.9 |
| LA4278B | 34.8 |
| LA4279 | 286.7 |
| LA4280 | 16 |
| LA4281A | 129.4 |
| LA4281B | 104.3 |
| LA4281D | 223.8 |
| LA4282A | 121.6 |
| LA4282B | 106.6 |
| LA4282C | 79.4 |
| LA4284 | 128.4 |
| LA4294A | 52 |
| LA4296 | 66.5 |
| LA4299 | 243.6 |
| LA4300A | 173.7 |
| LA4300B | 80.6 |
| LA4301A | 34.7 |
| LA4303 | 45.2 |
| LA4305 | 44.8 |
| LA4306A | 63 |
| LA4307 | 78.8 |
| LA4308 | 101.3 |
| LA4308A | 84.5 |
| LA4309 | 176.7 |
| LA4310 | 149.5 |
| LA4311 | 184 |
| LA4312A | 172.2 |
| LA4312B | 116.2 |
| LA4313A | 49.5 |
| LA4313B | 30.4 |
* Note
|