 |
 |
 |
 |
 |
 |
 |
 |
 |
 |
 |
 |
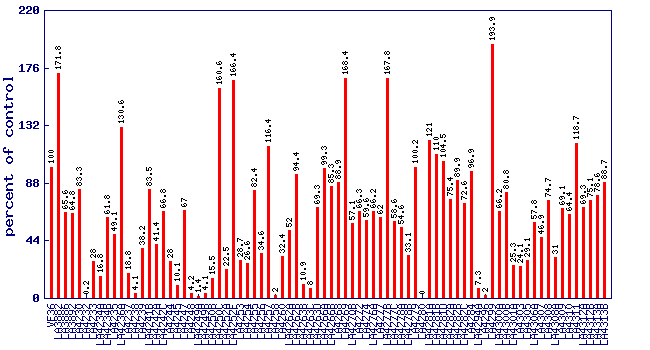
| Relative 1-penten-3-ol level (percent of control)* Experiment: flavor related metabolite profiling in S. lycopersicoides IL lines (FL, Fall 2015) |
 |
| line | relative level (percent of control) |
|---|---|
| VF36 | 100 |
| LA3882 | 171.8 |
| LA3886 | 65.6 |
| LA3892 | 64.8 |
| LA4230 | 83.3 |
| LA4232 | 0.2 |
| LA4233 | 28 |
| LA4234A | 16.8 |
| LA4234B | 61.8 |
| LA4235 | 49.1 |
| LA4236A | 130.6 |
| LA4237 | 18.8 |
| LA4238 | 4.1 |
| LA4239 | 38.2 |
| LA4241B | 83.5 |
| LA4242A | 41.4 |
| LA4242C | 66.8 |
| LA4244 | 28 |
| LA4245 | 10.1 |
| LA4247 | 67 |
| LA4248 | 4.2 |
| LA4249A | 1.4 |
| LA4249B | 4.1 |
| LA4250B | 15.5 |
| LA4250C | 160.6 |
| LA4252A | 22.5 |
| LA4252F | 166.4 |
| LA4253 | 28.7 |
| LA4254 | 26.6 |
| LA4255 | 82.4 |
| LA4256 | 34.6 |
| LA4257 | 116.4 |
| LA4258 | 2 |
| LA4260 | 32.4 |
| LA4262A | 52 |
| LA4262B | 94.4 |
| LA4263B | 10.9 |
| LA4263C | 8 |
| LA4263D | 69.3 |
| LA4266A | 99.3 |
| LA4266B | 85.3 |
| LA4268 | 88.9 |
| LA4269 | 168.4 |
| LA4270B | 57.1 |
| LA4272 | 66.3 |
| LA4274 | 59.6 |
| LA4276A | 66.2 |
| LA4277 | 62 |
| LA4277B | 167.8 |
| LA4277C | 58.6 |
| LA4278A | 54.6 |
| LA4278B | 33.1 |
| LA4279 | 100.2 |
| LA4280 | 0 |
| LA4281A | 121 |
| LA4281B | 110 |
| LA4281D | 104.5 |
| LA4282A | 75.4 |
| LA4282B | 89.9 |
| LA4282C | 72.6 |
| LA4284 | 96.9 |
| LA4294A | 7.3 |
| LA4296 | 2 |
| LA4299 | 193.9 |
| LA4300A | 66.2 |
| LA4300B | 80.8 |
| LA4301A | 25.3 |
| LA4303 | 24.1 |
| LA4305 | 29.1 |
| LA4306A | 57.8 |
| LA4307 | 46.9 |
| LA4308 | 74.7 |
| LA4308A | 31 |
| LA4309 | 69.1 |
| LA4310 | 64.4 |
| LA4311 | 118.7 |
| LA4312A | 69.3 |
| LA4312B | 75.1 |
| LA4313A | 78.6 |
| LA4313B | 88.7 |
* Note
|