 |
 |
 |
 |
 |
 |
 |
 |
 |
 |
 |
 |
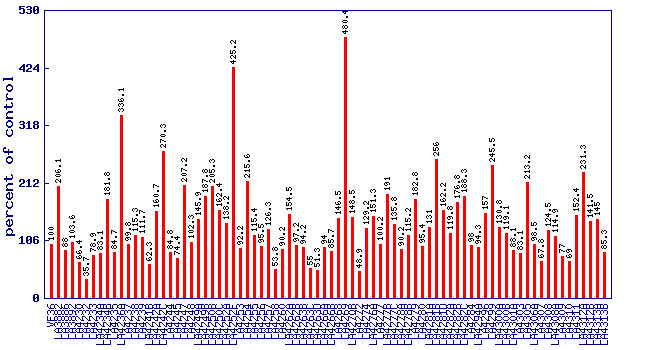
| Relative 1-penten-3-one level (percent of control)* Experiment: flavor related metabolite profiling in S. lycopersicoides IL lines (FL, Fall 2015) |
 |
| line | relative level (percent of control) |
|---|---|
| VF36 | 100 |
| LA3882 | 206.1 |
| LA3886 | 88 |
| LA3892 | 103.6 |
| LA4230 | 66.4 |
| LA4232 | 35.7 |
| LA4233 | 78.9 |
| LA4234A | 83.1 |
| LA4234B | 181.8 |
| LA4235 | 84.7 |
| LA4236A | 336.1 |
| LA4237 | 99.8 |
| LA4238 | 115.3 |
| LA4239 | 111.7 |
| LA4241B | 62.3 |
| LA4242A | 160.7 |
| LA4242C | 270.3 |
| LA4244 | 84.8 |
| LA4245 | 74.4 |
| LA4247 | 207.2 |
| LA4248 | 102.3 |
| LA4249A | 145.9 |
| LA4249B | 187.8 |
| LA4250B | 205.3 |
| LA4250C | 162.4 |
| LA4252A | 138.2 |
| LA4252F | 425.2 |
| LA4253 | 92.2 |
| LA4254 | 215.6 |
| LA4255 | 115.4 |
| LA4256 | 95.5 |
| LA4257 | 126.3 |
| LA4258 | 53.8 |
| LA4260 | 90.2 |
| LA4262A | 154.5 |
| LA4262B | 97.2 |
| LA4263B | 94.2 |
| LA4263C | 55 |
| LA4263D | 51.3 |
| LA4266A | 94 |
| LA4266B | 85.7 |
| LA4268 | 146.5 |
| LA4269 | 480.4 |
| LA4270B | 148.5 |
| LA4272 | 48.9 |
| LA4274 | 129.2 |
| LA4276A | 151.3 |
| LA4277 | 100.2 |
| LA4277B | 191 |
| LA4277C | 135.8 |
| LA4278A | 90.2 |
| LA4278B | 115.2 |
| LA4279 | 182.8 |
| LA4280 | 95.4 |
| LA4281A | 131 |
| LA4281B | 256 |
| LA4281D | 162.2 |
| LA4282A | 119.8 |
| LA4282B | 176.8 |
| LA4282C | 188.3 |
| LA4284 | 98 |
| LA4294A | 94.3 |
| LA4296 | 157 |
| LA4299 | 245.5 |
| LA4300A | 130.8 |
| LA4300B | 119.1 |
| LA4301A | 88.1 |
| LA4303 | 83.1 |
| LA4305 | 213.2 |
| LA4306A | 98.5 |
| LA4307 | 67.8 |
| LA4308 | 124.5 |
| LA4308A | 114.9 |
| LA4309 | 77 |
| LA4310 | 69 |
| LA4311 | 152.4 |
| LA4312A | 231.3 |
| LA4312B | 141.5 |
| LA4313A | 145 |
| LA4313B | 85.3 |
* Note
|