 |
 |
 |
 |
 |
 |
 |
 |
 |
 |
 |
 |
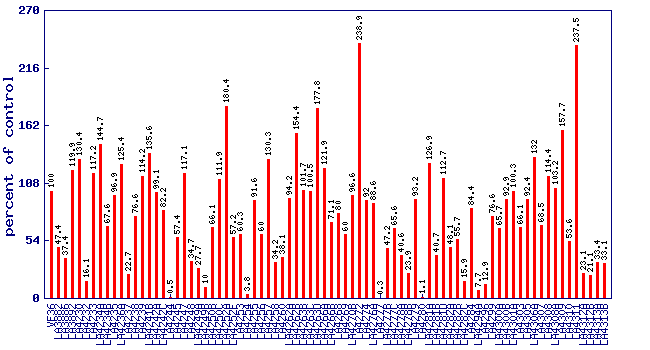
| Relative 2-isobutylthiazole level (percent of control)* Experiment: flavor related metabolite profiling in S. lycopersicoides IL lines (FL, Fall 2015) |
 |
| line | relative level (percent of control) |
|---|---|
| VF36 | 100 |
| LA3882 | 47.4 |
| LA3886 | 37.4 |
| LA3892 | 119.9 |
| LA4230 | 130.4 |
| LA4232 | 16.1 |
| LA4233 | 117.2 |
| LA4234A | 144.7 |
| LA4234B | 67.6 |
| LA4235 | 96.9 |
| LA4236A | 125.4 |
| LA4237 | 22.7 |
| LA4238 | 76.6 |
| LA4239 | 114.2 |
| LA4241B | 135.6 |
| LA4242A | 99.1 |
| LA4242C | 82.2 |
| LA4244 | 0.5 |
| LA4245 | 57.4 |
| LA4247 | 117.1 |
| LA4248 | 34.7 |
| LA4249A | 27.7 |
| LA4249B | 10 |
| LA4250B | 66.1 |
| LA4250C | 111.9 |
| LA4252A | 180.4 |
| LA4252F | 57.2 |
| LA4253 | 60.3 |
| LA4254 | 3.8 |
| LA4255 | 91.6 |
| LA4256 | 60 |
| LA4257 | 130.3 |
| LA4258 | 34.2 |
| LA4260 | 38.1 |
| LA4262A | 94.2 |
| LA4262B | 154.4 |
| LA4263B | 101.7 |
| LA4263C | 100.5 |
| LA4263D | 177.8 |
| LA4266A | 121.9 |
| LA4266B | 71.1 |
| LA4268 | 80 |
| LA4269 | 60 |
| LA4270B | 96.6 |
| LA4272 | 238.9 |
| LA4274 | 92 |
| LA4276A | 88.6 |
| LA4277 | 0.3 |
| LA4277B | 47.2 |
| LA4277C | 65.6 |
| LA4278A | 40.6 |
| LA4278B | 23.9 |
| LA4279 | 93.2 |
| LA4280 | 1.1 |
| LA4281A | 126.9 |
| LA4281B | 40.7 |
| LA4281D | 112.7 |
| LA4282A | 48.1 |
| LA4282B | 55.7 |
| LA4282C | 15.9 |
| LA4284 | 84.4 |
| LA4294A | 7.7 |
| LA4296 | 12.9 |
| LA4299 | 76.6 |
| LA4300A | 65.7 |
| LA4300B | 92.9 |
| LA4301A | 100.3 |
| LA4303 | 66.1 |
| LA4305 | 92.4 |
| LA4306A | 132 |
| LA4307 | 68.5 |
| LA4308 | 114.4 |
| LA4308A | 103.2 |
| LA4309 | 157.7 |
| LA4310 | 53.6 |
| LA4311 | 237.5 |
| LA4312A | 23.1 |
| LA4312B | 21.1 |
| LA4313A | 33.4 |
| LA4313B | 33.1 |
* Note
|