 |
 |
 |
 |
 |
 |
 |
 |
 |
 |
 |
 |
| Relative 2-methyl-1-butanol level (percent of control)* Experiment: flavor related metabolite profiling in S. lycopersicoides IL lines (FL, Fall 2015) |
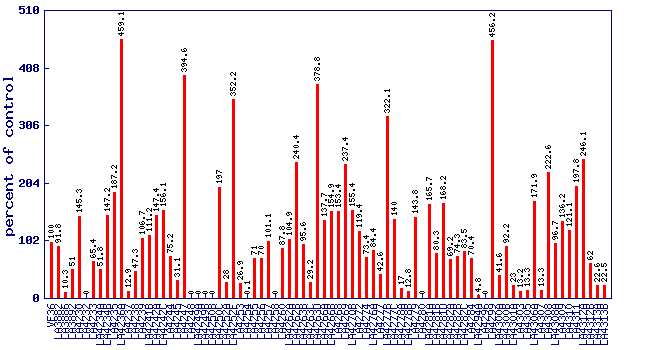 |
| line | relative level (percent of control) |
|---|---|
| VF36 | 100 |
| LA3882 | 91.8 |
| LA3886 | 10.3 |
| LA3892 | 51 |
| LA4230 | 145.3 |
| LA4232 | 0 |
| LA4233 | 65.4 |
| LA4234A | 51.8 |
| LA4234B | 147.2 |
| LA4235 | 187.2 |
| LA4236A | 459.1 |
| LA4237 | 12.9 |
| LA4238 | 47.3 |
| LA4239 | 106.7 |
| LA4241B | 111.2 |
| LA4242A | 147.4 |
| LA4242C | 156.1 |
| LA4244 | 75.2 |
| LA4245 | 31.1 |
| LA4247 | 394.6 |
| LA4248 | 0 |
| LA4249A | 0 |
| LA4249B | 0 |
| LA4250B | 0 |
| LA4250C | 197 |
| LA4252A | 28 |
| LA4252F | 352.2 |
| LA4253 | 26.9 |
| LA4254 | 0.1 |
| LA4255 | 71 |
| LA4256 | 70 |
| LA4257 | 101.1 |
| LA4258 | 0 |
| LA4260 | 87.8 |
| LA4262A | 104.9 |
| LA4262B | 240.4 |
| LA4263B | 95.6 |
| LA4263C | 29.2 |
| LA4263D | 378.8 |
| LA4266A | 137.7 |
| LA4266B | 154.9 |
| LA4268 | 153.4 |
| LA4269 | 237.4 |
| LA4270B | 155.4 |
| LA4272 | 119.4 |
| LA4274 | 73.4 |
| LA4276A | 84.4 |
| LA4277 | 42.6 |
| LA4277B | 322.1 |
| LA4277C | 140 |
| LA4278A | 17 |
| LA4278B | 12.8 |
| LA4279 | 143.8 |
| LA4280 | 0 |
| LA4281A | 165.7 |
| LA4281B | 80.3 |
| LA4281D | 168.2 |
| LA4282A | 69.2 |
| LA4282B | 74.3 |
| LA4282C | 83.5 |
| LA4284 | 70.4 |
| LA4294A | 4.8 |
| LA4296 | 0 |
| LA4299 | 456.2 |
| LA4300A | 41.6 |
| LA4300B | 92.2 |
| LA4301A | 23 |
| LA4303 | 13.2 |
| LA4305 | 13.3 |
| LA4306A | 171.9 |
| LA4307 | 13.3 |
| LA4308 | 222.6 |
| LA4308A | 96.7 |
| LA4309 | 136.2 |
| LA4310 | 121.1 |
| LA4311 | 197.8 |
| LA4312A | 246.1 |
| LA4312B | 62 |
| LA4313A | 22.6 |
| LA4313B | 22.5 |
* Note
|