 |
 |
 |
 |
 |
 |
 |
 |
 |
 |
 |
 |
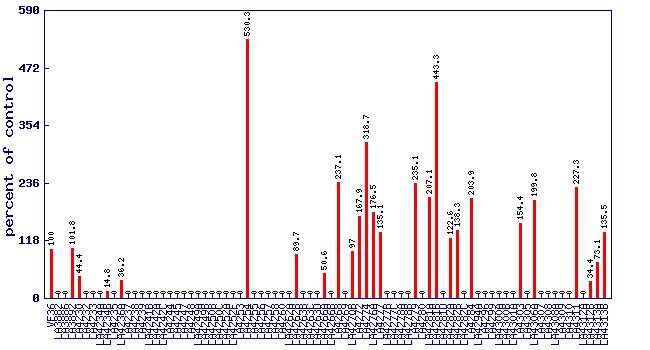
| Relative 2-phenylethanol level (percent of control)* Experiment: flavor related metabolite profiling in S. lycopersicoides IL lines (FL, Fall 2015) |
 |
| line | relative level (percent of control) |
|---|---|
| VF36 | 100 |
| LA3882 | 0 |
| LA3886 | 0 |
| LA3892 | 101.8 |
| LA4230 | 44.4 |
| LA4232 | 0 |
| LA4233 | 0 |
| LA4234A | 0 |
| LA4234B | 14.8 |
| LA4235 | 0 |
| LA4236A | 36.2 |
| LA4237 | 0 |
| LA4238 | 0 |
| LA4239 | 0 |
| LA4241B | 0 |
| LA4242A | 0 |
| LA4242C | 0 |
| LA4244 | 0 |
| LA4245 | 0 |
| LA4247 | 0 |
| LA4248 | 0 |
| LA4249A | 0 |
| LA4249B | 0 |
| LA4250B | 0 |
| LA4250C | 0 |
| LA4252A | 0 |
| LA4252F | 0 |
| LA4253 | 0 |
| LA4254 | 530.3 |
| LA4255 | 0 |
| LA4256 | 0 |
| LA4257 | 0 |
| LA4258 | 0 |
| LA4260 | 0 |
| LA4262A | 0 |
| LA4262B | 89.7 |
| LA4263B | 0 |
| LA4263C | 0 |
| LA4263D | 0 |
| LA4266A | 50.6 |
| LA4266B | 0 |
| LA4268 | 237.1 |
| LA4269 | 0 |
| LA4270B | 97 |
| LA4272 | 167.9 |
| LA4274 | 318.7 |
| LA4276A | 176.5 |
| LA4277 | 135.1 |
| LA4277B | 0 |
| LA4277C | 0 |
| LA4278A | 0 |
| LA4278B | 0 |
| LA4279 | 235.1 |
| LA4280 | 0 |
| LA4281A | 207.1 |
| LA4281B | 443.3 |
| LA4281D | 0 |
| LA4282A | 122.6 |
| LA4282B | 138.3 |
| LA4282C | 0 |
| LA4284 | 203.9 |
| LA4294A | 0 |
| LA4296 | 0 |
| LA4299 | 0 |
| LA4300A | 0 |
| LA4300B | 0 |
| LA4301A | 0 |
| LA4303 | 154.4 |
| LA4305 | 0 |
| LA4306A | 199.8 |
| LA4307 | 0 |
| LA4308 | 0 |
| LA4308A | 0 |
| LA4309 | 0 |
| LA4310 | 0 |
| LA4311 | 227.3 |
| LA4312A | 0 |
| LA4312B | 34.4 |
| LA4313A | 73.1 |
| LA4313B | 135.5 |
* Note
|